$169,500
3 bd|2 ba|1.8k sqft
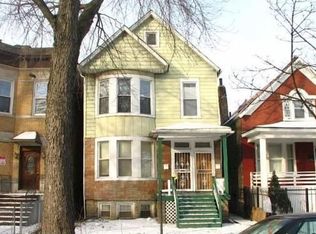
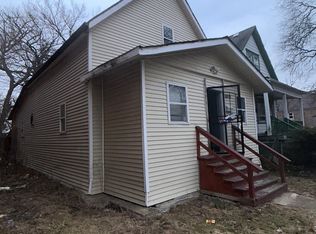
5602 S Morgan St, Chicago, IL 60621
Off Market
Zillow last checked: 7 hours ago
Listing updated: November 23, 2025 at 10:07pm
Carlos Matos 224-235-4336,
Core Realty & Investments Inc.
Not available
Estimated sales range
Not available
$2,434/mo
| Date | Event | Price |
|---|---|---|
| 11/18/2025 | Listed for sale | $149,900+1.4%$101/sqft |
Source: | ||
| 11/10/2025 | Contingent | $147,900$99/sqft |
Source: | ||
| 11/10/2025 | Listed for sale | $147,900$99/sqft |
Source: | ||
| 8/11/2025 | Contingent | $147,900$99/sqft |
Source: | ||
| 7/24/2025 | Price change | $147,900-1.3%$99/sqft |
Source: | ||
| 7/7/2025 | Listed for sale | $149,900$101/sqft |
Source: | ||
| 7/1/2025 | Contingent | $149,900$101/sqft |
Source: | ||
| 6/12/2025 | Listed for sale | $149,900-7.8%$101/sqft |
Source: | ||
| 11/19/2024 | Listing removed | $162,500$109/sqft |
Source: | ||
| 11/13/2024 | Price change | $162,500-4.4%$109/sqft |
Source: | ||
| 10/20/2024 | Price change | $169,900-5.6%$114/sqft |
Source: | ||
| 9/9/2024 | Price change | $179,900-5.3%$121/sqft |
Source: | ||
| 8/31/2024 | Listed for sale | $189,900+211.3%$128/sqft |
Source: | ||
| 3/4/2004 | Sold | $61,000$41/sqft |
Source: Public Record Report a problem | ||
| Year | Property taxes | Tax assessment |
|---|---|---|
| 2023 | $844 +2.6% | $4,000 |
| 2022 | $823 +2.3% | $4,000 |
| 2021 | $804 -45.4% | $4,000 -39.6% |
| 2020 | $1,474 -1.3% | $6,618 -11% |
| 2019 | $1,494 +1.7% | $7,436 |
| 2018 | $1,469 -37.9% | $7,436 -32.3% |
| 2017 | $2,366 +7.5% | $10,990 |
| 2016 | $2,201 +9.3% | $10,990 |
| 2015 | $2,014 +11% | $10,990 +12.4% |
| 2014 | $1,815 +2% | $9,780 |
| 2013 | $1,779 +1.4% | $9,780 |
| 2012 | $1,755 -2.9% | $9,780 -12.3% |
| 2011 | $1,808 -0.4% | $11,157 |
| 2010 | $1,816 +4.4% | $11,157 |
| 2009 | $1,740 -7.1% | $11,157 -14.5% |
| 2008 | $1,873 +1% | $13,054 |
| 2007 | $1,854 -1.1% | $13,054 |
| 2006 | $1,874 +78.1% | $13,054 +102.7% |
| 2005 | $1,052 +1% | $6,440 |
| 2004 | $1,042 +2.2% | $6,440 |
| 2003 | $1,019 +13.7% | $6,440 +29.1% |
| 2002 | $896 +3.7% | $4,988 |
| 2001 | $864 +25.5% | $4,988 |
| 2000 | $688 -0.7% | $4,988 +39.2% |
| 1999 | $693 | $3,583 |
Find assessor info on the county website
Source: MRED as distributed by MLS GRID. This data may not be complete. We recommend contacting the local school district to confirm school assignments for this home.