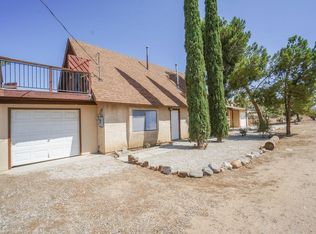
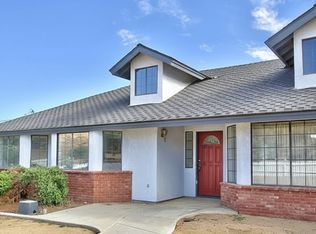
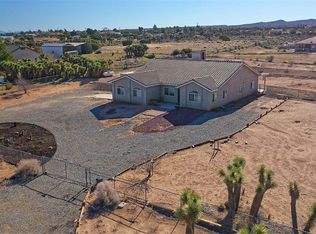
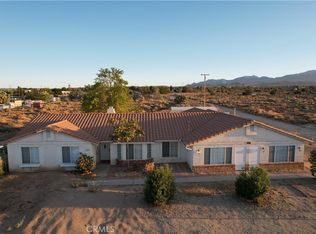
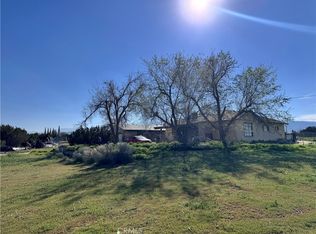
South Phelan, Check this out, not only valley views and clear, up close mountains views, a Six Bedroom home with three baths, Two septic tanks and two water heaters. Garage was converted for extra rooms - all permitted. Exterior and interior professionally painted February 2017 and new insulation installed. Located west of Eaby Road. All information deemed reliable, buyer to due their own investigations.
Pre-foreclosure
Est. $502,900
5374 Sunnyslope Rd, Phelan, CA 92371
6beds
2,385sqft
SingleFamily
Built in 1989
1.8 Acres Lot
$502,900 Zestimate®
$211/sqft
$-- HOA
Overview
- 309 days |
- 19 |
- 1 |
Facts & features
Interior
Bedrooms & bathrooms
- Bedrooms: 6
- Bathrooms: 3
- Full bathrooms: 3
Heating
- Other
Cooling
- Central
Appliances
- Included: Dishwasher, Range / Oven
Features
- Has fireplace: Yes
Interior area
- Total interior livable area: 2,385 sqft
Property
Parking
- Parking features: Garage
Features
- Exterior features: Stucco
- Has view: Yes
- View description: Territorial, Mountain
Lot
- Size: 1.8 Acres
Details
- Parcel number: 3066601030000
Construction
Type & style
- Home type: SingleFamily
Materials
- wood frame
- Roof: Composition
Condition
- Year built: 1989
Community & HOA
Community
- Features: On Site Laundry Available
Location
- Region: Phelan
Financial & listing details
- Price per square foot: $211/sqft
- Tax assessed value: $324,281
- Annual tax amount: $7,891
Visit our professional directory to find a foreclosure specialist in your area that can help with your home search.
Find a foreclosure agentForeclosure details
Estimated market value
$502,900
$463,000 - $543,000
$3,103/mo
Price history
Price history
| Date | Event | Price |
|---|---|---|
| 4/26/2018 | Sold | $285,000$119/sqft |
Source: Public Record Report a problem | ||
| 3/29/2018 | Pending sale | $285,000$119/sqft |
Source: J Tidwell & Associates #492049 Report a problem | ||
| 2/22/2018 | Price change | $285,000-1.7%$119/sqft |
Source: J Tidwell & Associates #492049 Report a problem | ||
| 10/28/2017 | Listed for sale | $290,000+1.8%$122/sqft |
Source: J Tidwell & Associates #492049 Report a problem | ||
| 8/8/2016 | Listing removed | $284,997$119/sqft |
Source: Keller Williams Realty #IG16103836 Report a problem | ||
| 7/27/2016 | Price change | $284,9970%$119/sqft |
Source: Keller Williams Realty #IG16103836 Report a problem | ||
| 7/1/2016 | Price change | $284,999-1.7%$119/sqft |
Source: Keller Williams Realty #IG16103836 Report a problem | ||
| 6/20/2016 | Price change | $289,9990%$122/sqft |
Source: Keller Williams Realty #IG16103836 Report a problem | ||
| 5/16/2016 | Listed for sale | $290,000+16%$122/sqft |
Source: Keller Williams Realty #IG16103836 Report a problem | ||
| 11/2/2012 | Listing removed | $249,900$105/sqft |
Source: Keller Williams Realty VVMC #418267 Report a problem | ||
| 7/11/2012 | Listed for sale | $249,900$105/sqft |
Source: Keller Williams Realty VVMC #418267 Report a problem | ||
Public tax history
Public tax history
| Year | Property taxes | Tax assessment |
|---|---|---|
| 2025 | $7,891 +3.3% | $324,281 +2% |
| 2024 | $7,640 +0.6% | $317,922 +2% |
| 2023 | $7,595 +1.1% | $311,688 +2% |
| 2022 | $7,510 +0.9% | $305,577 +2% |
| 2021 | $7,443 +0.6% | $299,586 +1% |
| 2020 | $7,398 +0.9% | $296,514 +2% |
| 2019 | $7,330 +224.2% | $290,700 +44.2% |
| 2018 | $2,261 +1.8% | $201,645 +2% |
| 2017 | $2,220 | $197,691 +2% |
| 2016 | $2,220 +2.2% | $193,815 +1.5% |
| 2015 | $2,173 +1.3% | $190,903 +2% |
| 2014 | $2,145 | $187,164 +0.5% |
| 2013 | -- | $186,318 +2% |
| 2012 | -- | $182,664 +2% |
| 2011 | -- | $179,082 +0.8% |
| 2010 | -- | $177,744 -0.2% |
| 2009 | -- | $178,166 +2% |
| 2008 | -- | $174,673 +2% |
| 2007 | -- | $171,248 +2% |
| 2006 | -- | $167,890 +2% |
| 2005 | -- | $164,598 +2% |
| 2004 | -- | $161,371 +42.8% |
| 2003 | -- | $113,034 |
| 2002 | -- | $113,034 |
| 2001 | -- | $113,034 |
| 2000 | -- | $113,034 |
Find assessor info on the county website
BuyAbility℠ payment
Estimated monthly payment
All calculations are estimates and provided by Zillow, Inc. for informational purposes only. Actual amounts may vary.
HOA fees may include property taxes on listings classified as Co-Ops. Contact the listing agent and/or owner for fee details.
Mortgage interest rates are dependent on a number of factors, including credit score, down payment, and repayment length. Interest rate data provided by Zillow Group Marketplace, Inc. as of 1/1/1970 from various mortgage lenders with which we have lead or other similar arrangements; the Estimated Payment is an average of those rates.
See how much you could borrow to make a competitive offer.
Boost your down payment with 6% savings match
Earn up to a 6% match & get a competitive APY with a *. Zillow has partnered with to help get you home faster.
Learn more*Terms apply. Match provided by Foyer. Account offered by Pacific West Bank, Member FDIC.Climate risks
Neighborhood: 92371
Nearby schools
GreatSchools rating
- 3/10Phelan Elementary SchoolGrades: K-5Distance: 1.7 mi
- 3/10Pinon Mesa Middle SchoolGrades: 6-8Distance: 1.6 mi
- 5/10Serrano High SchoolGrades: 9-12Distance: 1.6 mi
- California
- San Bernardino County
- Phelan
- 92371
- 5374 Sunnyslope Rd
Nearby cities
Nearby zip codes
Other Phelan Topics
