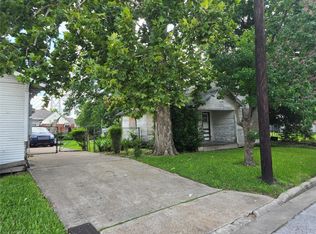
This 1104 square foot single family home has 3 bedrooms and 2.0 bathrooms. This home is located at 5304 Cochran St, Houston, TX 77009.
Foreclosed
Est. $251,100
5304 Cochran St, Houston, TX 77009
3beds
2baths
1,104sqft
SingleFamily
Built in 1940
5,000 Square Feet Lot
$251,100 Zestimate®
$227/sqft
$-- HOA
Overview
- 296 days |
- 17 |
- 0 |
Facts & features
Interior
Bedrooms & bathrooms
- Bedrooms: 3
- Bathrooms: 2
Heating
- Other, Gas
Cooling
- Other
Appliances
- Included: Dryer, Refrigerator, Washer
- Laundry: In Unit
Features
- Flooring: Tile, Laminate
Interior area
- Total interior livable area: 1,104 sqft
Property
Features
- Exterior features: Wood, Cement / Concrete
Lot
- Size: 5,000 Square Feet
- Features: Back Yard,Subdivided
Details
- Parcel number: 0311670000004
Construction
Type & style
- Home type: SingleFamily
Materials
- Frame
- Foundation: Crawl/Raised
- Roof: Composition
Condition
- Year built: 1940
Community & HOA
Location
- Region: Houston
Financial & listing details
- Price per square foot: $227/sqft
- Tax assessed value: $279,796
- Annual tax amount: $3,536
Visit our professional directory to find a foreclosure specialist in your area that can help with your home search.
Find a foreclosure agentForeclosure details
Estimated market value
$251,100
$213,000 - $291,000
$1,725/mo
Price history
Price history
| Date | Event | Price |
|---|---|---|
| 6/17/2025 | Sold | -- |
Source: Public Record Report a problem | ||
| 5/22/2025 | Price change | $239,000-11.4%$216/sqft |
Source: | ||
| 5/18/2025 | Price change | $269,900-3.6%$244/sqft |
Source: | ||
| 4/2/2025 | Price change | $279,900-3.4%$254/sqft |
Source: | ||
| 2/27/2025 | Listed for sale | $289,900+21.8%$263/sqft |
Source: | ||
| 9/11/2023 | Listing removed | -- |
Source: | ||
| 8/24/2023 | Price change | $1,900-5%$2/sqft |
Source: | ||
| 7/31/2023 | Listed for rent | $2,000+33.8%$2/sqft |
Source: | ||
| 5/15/2020 | Sold | -- |
Source: Agent Provided Report a problem | ||
| 3/13/2020 | Pending sale | $238,000$216/sqft |
Source: Coldwell Banker Realty - Heights #7327382 Report a problem | ||
| 2/21/2020 | Price change | $238,000-4.8%$216/sqft |
Source: Coldwell Banker Realty - Heights #7327382 Report a problem | ||
| 9/28/2019 | Listed for sale | $250,000+112.8%$226/sqft |
Source: Coldwell Banker United, #7327382 Report a problem | ||
| 3/26/2019 | Listing removed | $1,495$1/sqft |
Source: Coldwell Banker United, Realtors - Heights #56192339 Report a problem | ||
| 1/15/2019 | Price change | $1,495-3.5%$1/sqft |
Source: Coldwell Banker United, Realtors - Heights #56192339 Report a problem | ||
| 1/4/2019 | Listed for rent | $1,550$1/sqft |
Source: Coldwell Banker United, #56192339 Report a problem | ||
| 3/17/2009 | Sold | -- |
Source: Public Record Report a problem | ||
| 1/20/2009 | Listed for sale | $117,500$106/sqft |
Source: HAR #7478890 Report a problem | ||
Public tax history
Public tax history
| Year | Property taxes | Tax assessment |
|---|---|---|
| 2025 | $3,536 -5.1% | $279,796 +2.1% |
| 2024 | $3,728 -32.5% | $274,089 |
| 2023 | $5,522 -7.3% | $274,089 +1.3% |
| 2022 | $5,956 | $270,490 +28.6% |
| 2021 | -- | $210,281 -3.9% |
| 2020 | $5,250 +0.8% | $218,805 +1.8% |
| 2019 | $5,206 +42% | $215,003 +32.4% |
| 2018 | $3,665 | $162,381 +11.9% |
| 2017 | $3,665 +24.9% | $145,085 +25% |
| 2016 | $2,934 +54.7% | $116,039 +16% |
| 2015 | $1,897 | $100,070 +35.6% |
| 2014 | $1,897 | $73,791 |
| 2013 | -- | $73,791 -2.3% |
| 2012 | -- | $75,504 |
| 2011 | -- | $75,504 |
| 2010 | -- | $75,504 |
| 2009 | -- | $75,504 -16.5% |
| 2008 | -- | $90,375 +3.8% |
| 2007 | -- | $87,066 +185.8% |
| 2006 | -- | $30,466 +5.1% |
| 2005 | -- | $28,993 -4% |
| 2004 | -- | $30,200 +79.8% |
| 2003 | -- | $16,800 |
| 2002 | -- | $16,800 |
| 2001 | -- | $16,800 +21.7% |
| 2000 | -- | $13,800 |
Find assessor info on the county website
Monthly payment
Estimated monthly payment
All calculations are estimates and provided by Zillow, Inc. for informational purposes only. Actual amounts may vary.
HOA fees may include property taxes on listings classified as Co-Ops. Contact the listing agent and/or owner for fee details.
Mortgage interest rates are dependent on a number of factors, including credit score, down payment, and repayment length. Interest rate data provided by Zillow Group Marketplace, Inc. as of 1/1/1970 from various mortgage lenders with which we have lead or other similar arrangements; the Estimated Payment is an average of those rates.
See how much you could borrow to make a competitive offer.
Climate risks
Neighborhood: Northside Village
Nearby schools
GreatSchools rating
- 7/10Jefferson Elementary SchoolGrades: PK-5Distance: 0.9 mi
- 7/10Marshall Middle SchoolGrades: 6-8Distance: 1.9 mi
- 5/10Northside High SchoolGrades: 9-12Distance: 1.7 mi
Schools provided by the listing agent
- District: 27 - Houston
Source: The MLS. This data may not be complete. We recommend contacting the local school district to confirm school assignments for this home.
- Texas
- Harris County
- Houston
- 77009
- Northside Village
- 5304 Cochran St
Nearby cities
Nearby neighborhoods
Nearby zip codes
Other Houston Topics
