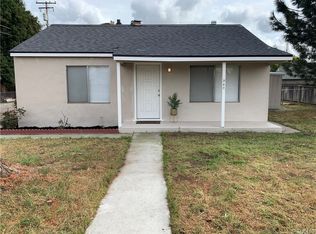
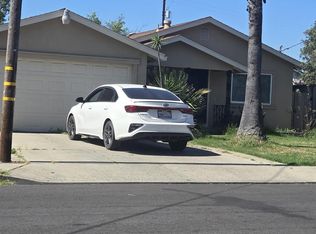
Very Cute Updated Cottage Style House Near Turlock's New Safety Center. All New Dual Pane Windows. New Tile and Laminated Wood Floors. Fresh Paint Inside and Out. Large Private Fenced in Yard, Including Chain Linked Fencing. 2 Covered Patios. Gated and Covered Carport. Alley Access. Clean, Sharp, Move in Ready.
Pre-foreclosure
Est. $320,900
530 Chestnut St, Turlock, CA 95380
1beds
1baths
873sqft
SingleFamily
Built in 1950
5,227 Square Feet Lot
$320,900 Zestimate®
$368/sqft
$-- HOA
Overview
- 195 days |
- 26 |
- 0 |
Facts & features
Interior
Bedrooms & bathrooms
- Bedrooms: 1
- Bathrooms: 1
Heating
- Wall
Cooling
- Other
Features
- Has fireplace: Yes
Interior area
- Total interior livable area: 873 sqft
Property
Parking
- Total spaces: 1
- Parking features: Carport
Features
- Exterior features: Stucco
Lot
- Size: 5,227 Square Feet
Details
- Parcel number: 061007027000
Construction
Type & style
- Home type: SingleFamily
Materials
- masonry
- Roof: Other
Condition
- Year built: 1950
Community & HOA
Location
- Region: Turlock
Financial & listing details
- Price per square foot: $368/sqft
- Tax assessed value: $296,514
- Annual tax amount: $3,182
Visit our professional directory to find a foreclosure specialist in your area that can help with your home search.
Find a foreclosure agentForeclosure details
Estimated market value
$320,900
$305,000 - $337,000
$1,360/mo
Price history
Price history
| Date | Event | Price |
|---|---|---|
| 10/21/2022 | Sold | $285,000$326/sqft |
Source: MetroList Services of CA #222111480 Report a problem | ||
| 8/26/2022 | Pending sale | $285,000$326/sqft |
Source: | ||
| 8/20/2022 | Listed for sale | $285,000+118.4%$326/sqft |
Source: | ||
| 7/8/2015 | Sold | $130,500+74.2%$149/sqft |
Source: MetroList Services of CA #15030860 Report a problem | ||
| 8/7/2013 | Listing removed | $74,900$86/sqft |
Source: CENTURY 21 M&M And Associates #13033553 Report a problem | ||
| 8/4/2013 | Pending sale | $74,900+4.8%$86/sqft |
Source: CENTURY 21 M&M And Associates #13033553 Report a problem | ||
| 8/2/2013 | Sold | $71,500-4.5%$82/sqft |
Source: MetroList Services of CA #13033553 Report a problem | ||
| 7/19/2013 | Price change | $74,900-2.6%$86/sqft |
Source: Century 21 M & M and Assoc. #13033553 Report a problem | ||
| 7/4/2013 | Price change | $76,900-6.1%$88/sqft |
Source: Century 21 M & M and Assoc. #13033553 Report a problem | ||
| 6/26/2013 | Price change | $81,900-8%$94/sqft |
Source: Century 21 M & M and Assoc. #13033553 Report a problem | ||
| 6/14/2013 | Listed for sale | $89,000+78%$102/sqft |
Source: CENTURY 21 M&M And Associates #13033553 Report a problem | ||
| 3/25/2013 | Sold | $50,000$57/sqft |
Source: Public Record Report a problem | ||
| 12/15/2012 | Listed for sale | $50,000+28.2%$57/sqft |
Source: PMZ Real Estate #12072550 Report a problem | ||
| 10/10/1997 | Sold | $39,000$45/sqft |
Source: Public Record Report a problem | ||
Public tax history
Public tax history
| Year | Property taxes | Tax assessment |
|---|---|---|
| 2025 | $3,182 +1.9% | $296,514 +2% |
| 2024 | $3,123 +0.2% | $290,700 +2% |
| 2023 | $3,118 +29.7% | $285,000 +30.7% |
| 2022 | $2,404 +52.3% | $218,064 +53.3% |
| 2021 | $1,578 +0.7% | $142,281 +1% |
| 2020 | $1,567 +1.7% | $140,823 +2% |
| 2019 | $1,541 +0.1% | $138,062 +2% |
| 2018 | $1,540 +2.4% | $135,356 +2% |
| 2017 | $1,504 +7.1% | $132,702 +2% |
| 2016 | $1,404 +78.7% | $130,100 +78.4% |
| 2015 | $786 | $72,928 +2% |
| 2014 | $786 | $71,500 +47.1% |
| 2012 | -- | $48,603 |
| 2011 | -- | $48,603 +0.8% |
| 2010 | -- | $48,241 -0.2% |
| 2009 | -- | $48,355 +2% |
| 2008 | -- | $47,408 +2% |
| 2007 | -- | $46,479 +2% |
| 2006 | -- | $45,568 +2% |
| 2005 | -- | $44,675 +2% |
| 2004 | $397 +4.2% | $43,800 +1.9% |
| 2003 | $382 | $42,998 +2% |
| 2002 | -- | $42,154 +2% |
| 2001 | $367 +1.8% | $41,327 +2% |
| 2000 | $360 | $40,517 |
Find assessor info on the county website
BuyAbility℠ payment
Estimated monthly payment
All calculations are estimates and provided by Zillow, Inc. for informational purposes only. Actual amounts may vary.
HOA fees may include property taxes on listings classified as Co-Ops. Contact the listing agent and/or owner for fee details.
Mortgage interest rates are dependent on a number of factors, including credit score, down payment, and repayment length. Interest rate data provided by Zillow Group Marketplace, Inc. as of 1/1/1970 from various mortgage lenders with which we have lead or other similar arrangements; the Estimated Payment is an average of those rates.
See how much you could borrow to make a competitive offer.
Boost your down payment with 6% savings match
Earn up to a 6% match & get a competitive APY with a *. Zillow has partnered with to help get you home faster.
Learn more*Terms apply. Match provided by Foyer. Account offered by Pacific West Bank, Member FDIC.Climate risks
Neighborhood: 95380
Nearby schools
GreatSchools rating
- 4/10Crowell Elementary SchoolGrades: K-6Distance: 0.8 mi
- 7/10Marvin A. Dutcher Middle SchoolGrades: 6-8Distance: 1.1 mi
- 7/10John H. Pitman High SchoolGrades: 9-12Distance: 2.5 mi
- California
- Stanislaus County
- Turlock
- 95380
- 530 Chestnut St
Nearby cities
Nearby zip codes
Other Turlock Topics
