Neighborhood Description
Very small neighborhood 100+homes. Quiet, country style roads just repaved. One entrance and exit into and out of neighborhood. Park style seating at front of neighborhood for school bus stop/wait area. Less than 3 miles to (2) Publix, Walmart, Paddock Mall and other major stores and restaurants. 1/2 mile to Pine Ave or 17th Street.
Pre-foreclosure
Est. $183,200
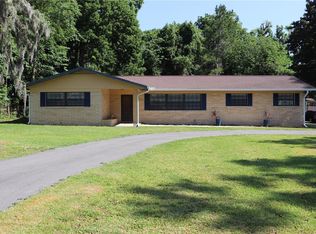
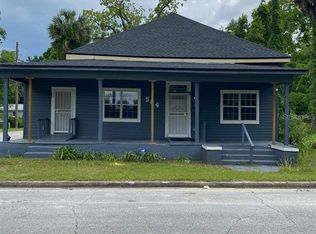
511 SW 38th St, Ocala, FL 34471
3beds
2,252sqft
SingleFamily
Built in 1965
0.5 Acres Lot
$183,200 Zestimate®
$81/sqft
$-- HOA
Overview
- 330 days |
- 156 |
- 8 |
Facts & features
Interior
Bedrooms & bathrooms
- Bedrooms: 3
- Bathrooms: 2
- Full bathrooms: 2
Heating
- Forced air, Electric
Cooling
- Central
Appliances
- Included: Dryer, Microwave, Range / Oven, Refrigerator, Washer
Features
- Flooring: Tile, Carpet, Hardwood
- Basement: None
- Has fireplace: Yes
Interior area
- Total interior livable area: 2,252 sqft
Property
Parking
- Total spaces: 2
- Parking features: Garage - Attached, Off-street
Features
- Exterior features: Shingle, Wood, Brick, Cement / Concrete
- Has view: Yes
- View description: None
Lot
- Size: 0.5 Acres
Details
- Parcel number: 3065001061
Construction
Type & style
- Home type: SingleFamily
Materials
- Concrete Block
- Foundation: Concrete Block
- Roof: Shake / Shingle
Condition
- Year built: 1965
Community & HOA
Location
- Region: Ocala
Financial & listing details
- Price per square foot: $81/sqft
- Tax assessed value: $115,674
- Annual tax amount: $885
Visit our professional directory to find a foreclosure specialist in your area that can help with your home search.
Find a foreclosure agentForeclosure details
Estimated market value
$183,200
$148,000 - $216,000
$2,065/mo
Price history
Price history
| Date | Event | Price |
|---|---|---|
| 7/22/2017 | Listing removed | $104,000$46/sqft |
Source: JBM REALTY LLC #O5505359 Report a problem | ||
| 7/18/2017 | Listed for sale | $104,000$46/sqft |
Source: JBM REALTY LLC #O5505359 Report a problem | ||
| 7/18/2017 | Pending sale | $104,000$46/sqft |
Source: JBM REALTY LLC #O5505359 Report a problem | ||
| 6/6/2017 | Price change | $104,000-4.6%$46/sqft |
Source: JBM REALTY LLC #O5505359 Report a problem | ||
| 5/15/2017 | Price change | $109,000-5.2%$48/sqft |
Source: JBM REALTY LLC #O5505359 Report a problem | ||
| 5/3/2017 | Price change | $115,000-4.2%$51/sqft |
Source: JBM REALTY LLC #O5505359 Report a problem | ||
| 4/30/2017 | Price change | $120,000-4%$53/sqft |
Source: JBM REALTY LLC #O5505359 Report a problem | ||
| 4/24/2017 | Price change | $124,999-7.4%$56/sqft |
Source: JBM REALTY LLC #O5505359 Report a problem | ||
| 4/21/2017 | Price change | $134,999-6.9%$60/sqft |
Source: JBM REALTY LLC #O5505359 Report a problem | ||
| 4/19/2017 | Listed for sale | $145,000+31.8%$64/sqft |
Source: JBM REALTY LLC #O5505359 Report a problem | ||
| 1/8/2003 | Sold | $110,000$49/sqft |
Source: Public Record Report a problem | ||
Public tax history
Public tax history
| Year | Property taxes | Tax assessment |
|---|---|---|
| 2024 | $885 +3.4% | $77,234 +3% |
| 2023 | $856 +1.2% | $74,984 +3% |
| 2022 | $846 -1% | $72,800 +3% |
| 2021 | $854 +0.2% | $70,680 +1.4% |
| 2020 | $853 +0.4% | $69,704 +2.3% |
| 2019 | $849 | $68,137 +1.9% |
| 2018 | $849 +4.1% | $66,867 +2.1% |
| 2017 | $816 -38.6% | $65,492 +2.1% |
| 2016 | $1,330 | $64,145 +0.7% |
| 2015 | $1,330 +2.9% | $63,699 +0.8% |
| 2014 | $1,292 +0.9% | $63,193 +1.5% |
| 2013 | $1,281 -3.5% | $62,259 -8.5% |
| 2012 | $1,328 -2.1% | $68,042 -4.9% |
| 2011 | $1,356 -2.3% | $71,564 -5.6% |
| 2010 | $1,388 +2.5% | $75,792 +2.7% |
| 2009 | $1,354 +0.5% | $73,799 +0.1% |
| 2008 | $1,347 -9% | $73,726 +3% |
| 2007 | $1,479 +49.8% | $71,579 +2.5% |
| 2006 | $988 +5.4% | $69,835 +3% |
| 2005 | $937 | $67,801 +3% |
| 2004 | $937 +23.9% | $65,826 +21.7% |
| 2002 | $756 +11.5% | $54,081 +4.6% |
| 2001 | $678 | $51,680 |
| 2000 | $678 | $51,680 |
Find assessor info on the county website
BuyAbility℠ payment
Estimated monthly payment
All calculations are estimates and provided by Zillow, Inc. for informational purposes only. Actual amounts may vary.
HOA fees may include property taxes on listings classified as Co-Ops. Contact the listing agent and/or owner for fee details.
Mortgage interest rates are dependent on a number of factors, including credit score, down payment, and repayment length. Interest rate data provided by Zillow Group Marketplace, Inc. as of 1/1/1970 from various mortgage lenders with which we have lead or other similar arrangements; the Estimated Payment is an average of those rates.
See how much you could borrow to make a competitive offer.
Boost your down payment with 6% savings match
Earn up to a 6% match & get a competitive APY with a *. Zillow has partnered with to help get you home faster.
Learn more*Terms apply. Match provided by Foyer. Account offered by Pacific West Bank, Member FDIC.Climate risks
Neighborhood: 34471
Nearby schools
GreatSchools rating
- 6/10Shady Hill Elementary SchoolGrades: PK-5Distance: 1.7 mi
- 4/10Liberty Middle SchoolGrades: 6-8Distance: 5.5 mi
- 3/10Belleview High SchoolGrades: 9-12Distance: 6.2 mi
Schools provided by the listing agent
- Elementary: Shady Road Elem School
- Middle: West Port Middle
- High: Forest High School & West Port High
- District: Marion County
Source: The MLS. This data may not be complete. We recommend contacting the local school district to confirm school assignments for this home.

- Florida
- Marion County
- Ocala
- 34471
- Sherwood Hills
- 511 SW 38th St
Nearby cities
Nearby neighborhoods
Nearby zip codes
Other Ocala Topics
