$240,600
4 bd|2 ba|969 sqft
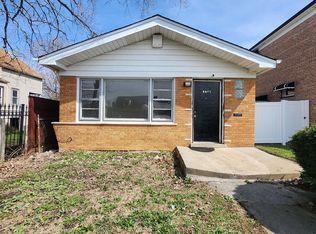
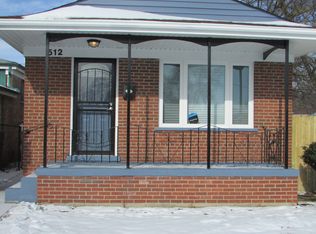
512 E 87th St, Chicago, IL 60619
Off Market
Zillow last checked: 7 hours ago
Listing updated: February 27, 2026 at 03:23pm
Reginald Patterson (773)606-6515,
eXp Realty
Not available
Estimated sales range
Not available
Not available
| Date | Event | Price |
|---|---|---|
| 2/27/2026 | Contingent | $139,900$117/sqft |
Source: | ||
| 2/17/2026 | Listed for sale | $139,900$117/sqft |
Source: | ||
| 1/21/2026 | Listing removed | $139,900$117/sqft |
Source: eXp Realty #12458548 Report a problem | ||
| 1/20/2026 | Listed for sale | $139,900$117/sqft |
Source: | ||
| 9/12/2025 | Contingent | $139,900$117/sqft |
Source: | ||
| 8/29/2025 | Listed for sale | $139,900-15.2%$117/sqft |
Source: | ||
| 8/29/2025 | Listing removed | $164,900$137/sqft |
Source: | ||
| 8/11/2025 | Listed for sale | $164,900-10.8%$137/sqft |
Source: | ||
| 8/11/2025 | Listing removed | $184,900$154/sqft |
Source: | ||
| 8/4/2025 | Listed for sale | $184,900+42.2%$154/sqft |
Source: | ||
| 3/11/2021 | Sold | $130,000-7.1%$108/sqft |
Source: | ||
| 2/15/2021 | Pending sale | $140,000$117/sqft |
Source: | ||
| 1/11/2021 | Contingent | $140,000$117/sqft |
Source: | ||
| 1/11/2021 | Pending sale | $140,000$117/sqft |
Source: RE/MAX 10 #10944577 Report a problem | ||
| 12/18/2020 | Price change | $140,000-6.6%$117/sqft |
Source: RE/MAX 10 #10944577 Report a problem | ||
| 12/1/2020 | Listed for sale | $149,900$125/sqft |
Source: RE/MAX 10 #10944577 Report a problem | ||
| Year | Property taxes | Tax assessment |
|---|---|---|
| 2023 | $3,165 +2.6% | $14,999 |
| 2022 | $3,085 +2.3% | $14,999 |
| 2021 | $3,016 +4.5% | $14,999 +15.8% |
| 2020 | $2,886 -0.2% | $12,954 -10% |
| 2019 | $2,892 +1.7% | $14,394 |
| 2018 | $2,843 -8.5% | $14,394 -0.3% |
| 2017 | $3,109 +7.5% | $14,442 |
| 2016 | $2,893 +9.3% | $14,442 |
| 2015 | $2,646 +10.9% | $14,442 +12.3% |
| 2014 | $2,385 +2% | $12,856 |
| 2013 | $2,338 +1.4% | $12,856 |
| 2012 | $2,307 -14.7% | $12,856 -22.9% |
| 2011 | $2,703 -0.4% | $16,681 |
| 2010 | $2,714 +74.7% | $16,681 |
| 2009 | $1,554 +240.8% | $16,681 -5.9% |
| 2008 | $456 -12.8% | $17,730 |
| 2007 | $523 -5.8% | $17,730 |
| 2006 | $555 -15.4% | $17,730 +46.3% |
| 2005 | $656 -55% | $12,115 |
| 2004 | $1,457 -9.5% | $12,115 |
| 2003 | $1,611 +85% | $12,115 +7.2% |
| 2002 | $871 -45.8% | $11,302 |
| 2001 | $1,607 +10.6% | $11,302 |
| 2000 | $1,453 +0.2% | $11,302 +18.2% |
| 1999 | $1,450 | $9,561 |
Find assessor info on the county website
Source: MRED as distributed by MLS GRID. This data may not be complete. We recommend contacting the local school district to confirm school assignments for this home.