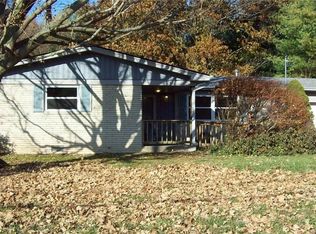
Good Opportunity For Someone Wanting A Major Project. Huge Great Room With Soaring Ceiling And A Fireplace. Apartment Above Garage With Private Access. Pasture Area With 2 Small Outbuildings. Major Work Needed! Discoloration In Home Has Not Been Tested-Enter At Your Own Risk! Employees And Family Members Of Jpmorgan Chase Bank, N.A, Its Affiliates Or Subsidiaries Are Strictly Prohibited From Directly Or Indirectly Purchasing Any Property Owned By Jpmorgan Chase Bank, N.A.
Foreclosed
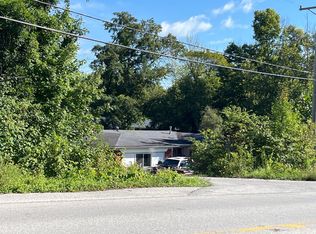
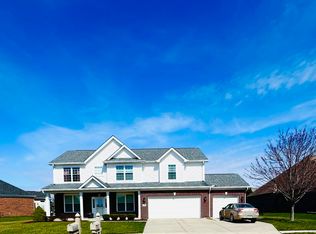
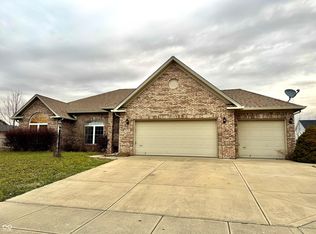
Street View
Est. $516,700
5075 Olive Branch Rd, Greenwood, IN 46143
3beds
3,966sqft
SingleFamily
Built in 1977
2.1 Acres Lot
$-- Zestimate®
$130/sqft
$-- HOA
Overview
- 30 days |
- 526 |
- 18 |
Facts & features
Interior
Bedrooms & bathrooms
- Bedrooms: 3
- Bathrooms: 3
- Full bathrooms: 2
- 1/2 bathrooms: 1
Heating
- Other
Cooling
- Central
Features
- Basement: Finished
- Has fireplace: Yes
- Fireplace features: masonry
Interior area
- Total interior livable area: 3,966 sqft
Property
Parking
- Parking features: Garage - Attached
Lot
- Size: 2.1 Acres
Details
- Parcel number: 410409011001000038
Construction
Type & style
- Home type: SingleFamily
Materials
- Roof: Asphalt
Condition
- Year built: 1977
Community & HOA
Location
- Region: Greenwood
Financial & listing details
- Price per square foot: $130/sqft
- Tax assessed value: $516,700
- Annual tax amount: $4,709
Visit our professional directory to find a foreclosure specialist in your area that can help with your home search.
Find a foreclosure agentForeclosure details
Estimated market value
Not available
Estimated sales range
Not available
$2,322/mo
Price history
Price history
| Date | Event | Price |
|---|---|---|
| 2/25/2026 | Sold | $470,662-14.4%$119/sqft |
Source: Public Record Report a problem | ||
| 2/8/2025 | Listing removed | $550,000$139/sqft |
Source: | ||
| 9/27/2024 | Price change | $550,000-8.3%$139/sqft |
Source: | ||
| 8/21/2024 | Price change | $600,000-4%$151/sqft |
Source: | ||
| 8/7/2024 | Listed for sale | $625,000+321.2%$158/sqft |
Source: | ||
| 9/22/2015 | Sold | $148,400+1.9%$37/sqft |
Source: | ||
| 9/14/2015 | Pending sale | $145,600$37/sqft |
Source: Dollens Real Estate Services #21372820 Report a problem | ||
| 8/25/2015 | Listed for sale | $145,600-53%$37/sqft |
Source: Dollens Real Estate Services #21372820 Report a problem | ||
| 9/4/2011 | Listing removed | $309,900$78/sqft |
Source: Tomorrow Realty, Inc. #21110850 Report a problem | ||
| 3/26/2011 | Listed for sale | $309,900+27.3%$78/sqft |
Source: Tomorrow Realty, Inc. #21110850 Report a problem | ||
| 9/21/2005 | Sold | $243,500-17.5%$61/sqft |
Source: | ||
| 6/22/2005 | Sold | $295,000$74/sqft |
Source: Public Record Report a problem | ||
Public tax history
Public tax history
| Year | Property taxes | Tax assessment |
|---|---|---|
| 2024 | $4,709 -0.7% | $516,700 +13.6% |
| 2023 | $4,741 +12.5% | $454,900 -0.2% |
| 2022 | $4,214 +12.2% | $455,600 +11.8% |
| 2021 | $3,756 +9.4% | $407,400 +8.8% |
| 2020 | $3,431 +0.7% | $374,600 +9.4% |
| 2019 | $3,407 -37.5% | $342,400 +2.1% |
| 2018 | $5,454 -5.3% | $335,400 +3.9% |
| 2017 | $5,759 | $322,900 -4.8% |
| 2016 | $5,759 +30.3% | $339,100 +3.1% |
| 2014 | $4,419 -17.4% | $328,900 -0.2% |
| 2013 | $5,348 +91.7% | $329,400 +13.7% |
| 2012 | $2,790 +14.4% | $289,700 +9.9% |
| 2011 | $2,438 -1.8% | $263,600 |
| 2010 | $2,483 -1.7% | $263,600 +0.6% |
| 2009 | $2,526 -5.8% | $262,100 +2.1% |
| 2007 | $2,681 -10.5% | $256,600 +4.7% |
| 2006 | $2,995 | $245,100 |
Find assessor info on the county website
BuyAbility℠ payment
Estimated monthly payment
All calculations are estimates and provided by Zillow, Inc. for informational purposes only. Actual amounts may vary.
HOA fees may include property taxes on listings classified as Co-Ops. Contact the listing agent and/or owner for fee details.
Mortgage interest rates are dependent on a number of factors, including credit score, down payment, and repayment length. Interest rate data provided by Zillow Group Marketplace, Inc. as of 1/1/1970 from various mortgage lenders with which we have lead or other similar arrangements; the Estimated Payment is an average of those rates.
See how much you could borrow to make a competitive offer.
Boost your down payment with 6% savings match
Earn up to a 6% match & get a competitive APY with a *. Zillow has partnered with to help get you home faster.
Learn more*Terms apply. Match provided by Foyer. Account offered by Pacific West Bank, Member FDIC.Climate risks
Neighborhood: 46143
Nearby schools
GreatSchools rating
- 7/10Center Grove Elementary SchoolGrades: K-5Distance: 0.8 mi
- 8/10Center Grove Middle School CentralGrades: 6-8Distance: 0.9 mi
- 10/10Center Grove High SchoolGrades: 9-12Distance: 1.1 mi
- Indiana
- Johnson County
- Greenwood
- 46143
- 5075 Olive Branch Rd
Nearby cities
Nearby zip codes
Other Greenwood Topics
