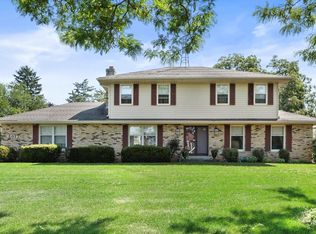
Single Family Ranch with full basement, partially finished with full bathroom/laundry in basement.
Pre-foreclosure
Street View
Est. $346,600
505 Paul St, Burlington, WI 53105
3beds
1,652sqft
SingleFamily
Built in 1977
0.29 Acres Lot
$346,600 Zestimate®
$210/sqft
$-- HOA
Overview
- 248 days |
- 43 |
- 3 |
Facts & features
Interior
Bedrooms & bathrooms
- Bedrooms: 3
- Bathrooms: 3
- Full bathrooms: 3
Heating
- Forced air, Gas
Cooling
- Central
Appliances
- Included: Dishwasher, Dryer, Freezer, Garbage disposal, Microwave, Range / Oven, Refrigerator, Washer
Features
- Flooring: Carpet, Concrete, Hardwood
- Basement: Basement (not specified)
- Has fireplace: Yes
Interior area
- Total interior livable area: 1,652 sqft
Property
Parking
- Total spaces: 2
- Parking features: Garage
Features
- Exterior features: Wood, Brick
- Has view: Yes
- View description: None
Lot
- Size: 0.29 Acres
Details
- Parcel number: 176031911376000
Construction
Type & style
- Home type: SingleFamily
Materials
- Roof: Shake / Shingle
Condition
- Year built: 1977
Community & HOA
Location
- Region: Burlington
Financial & listing details
- Price per square foot: $210/sqft
- Tax assessed value: $196,800
- Annual tax amount: $3,144
Visit our professional directory to find a foreclosure specialist in your area that can help with your home search.
Find a foreclosure agentForeclosure details
Estimated market value
$346,600
$322,000 - $371,000
$2,652/mo
Price history
Price history
Price history is unavailable.
Public tax history
Public tax history
| Year | Property taxes | Tax assessment |
|---|---|---|
| 2024 | $3,144 -1.7% | $196,800 |
| 2023 | $3,197 +11.7% | $196,800 |
| 2022 | $2,863 -6.2% | $196,800 |
| 2021 | $3,051 | $196,800 |
| 2020 | -- | $196,800 |
| 2019 | $3,238 +4.7% | $196,800 |
| 2018 | $3,092 -5.3% | $196,800 |
| 2017 | $3,266 +4.6% | $196,800 |
| 2016 | $3,123 | $196,800 |
| 2015 | $3,123 -6% | $196,800 |
| 2014 | $3,323 -10.8% | $196,800 |
| 2013 | $3,725 +6.7% | $196,800 |
| 2012 | $3,491 -9.2% | $196,800 |
| 2011 | $3,842 +13% | $196,800 |
| 2010 | $3,400 -4.9% | $196,800 |
| 2009 | $3,574 +4.8% | $196,800 |
| 2008 | $3,411 -3.5% | $196,800 |
| 2007 | $3,533 +11.3% | $196,800 +55.9% |
| 2006 | $3,174 +6.8% | $126,200 |
| 2005 | $2,973 +6.5% | $126,200 |
| 2004 | $2,791 -0.5% | $126,200 |
| 2003 | $2,806 +3.6% | $126,200 |
| 2002 | $2,710 -0.8% | $126,200 |
| 2001 | $2,731 +15.8% | $126,200 |
| 2000 | $2,359 | $126,200 |
Find assessor info on the county website
Monthly payment
Estimated monthly payment
All calculations are estimates and provided by Zillow, Inc. for informational purposes only. Actual amounts may vary.
HOA fees may include property taxes on listings classified as Co-Ops. Contact the listing agent and/or owner for fee details.
Mortgage interest rates are dependent on a number of factors, including credit score, down payment, and repayment length. Interest rate data provided by Zillow Group Marketplace, Inc. as of 1/1/1970 from various mortgage lenders with which we have lead or other similar arrangements; the Estimated Payment is an average of those rates.
See how much you could borrow to make a competitive offer.
Climate risks
Neighborhood: 53105
Nearby schools
GreatSchools rating
- 6/10Woodfield Elementary SchoolGrades: PK-5Distance: 1.8 mi
- 7/10Fox River Middle SchoolGrades: 6-8Distance: 2.2 mi
- 6/10Waterford High SchoolGrades: 9-12Distance: 2 mi
- Wisconsin
- Racine County
- Rochester
- 53105
- 505 Paul St
Nearby cities
Nearby zip codes
Other Rochester Topics
