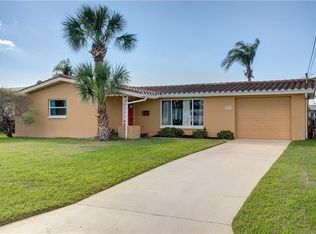
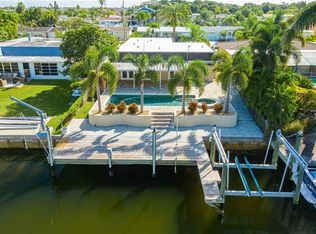
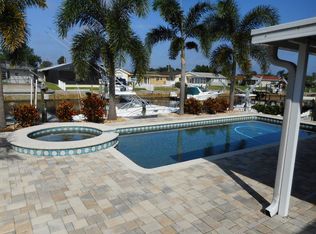
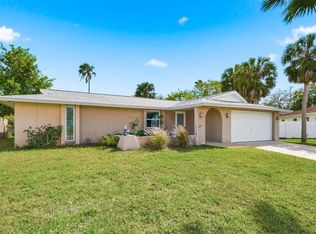
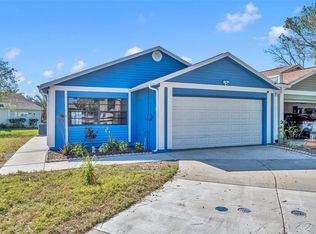
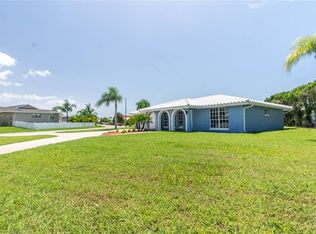
SAILBOAT WATER. 60FT WATERFRONT!! 2 BED ,1.5 BATH.
Pre-foreclosure
Est. $353,700
5003 Pelican Dr, New Port Richey, FL 34652
2beds
1,344sqft
SingleFamily
Built in 1968
7,501 Square Feet Lot
$353,700 Zestimate®
$263/sqft
$8/mo HOA
Overview
- 173 days |
- 29 |
- 5 |
Facts & features
Interior
Bedrooms & bathrooms
- Bedrooms: 2
- Bathrooms: 2
- Full bathrooms: 2
- 1/2 bathrooms: 1
Heating
- Forced air, Electric
Cooling
- Central
Appliances
- Included: Microwave, Range / Oven, Refrigerator
Features
- Flooring: Carpet
- Has fireplace: No
Interior area
- Total interior livable area: 1,344 sqft
Property
Parking
- Total spaces: 1
- Parking features: Carport, Garage - Attached
Features
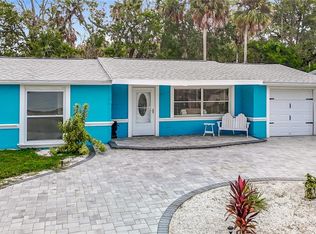
- Exterior features: Stucco
- Has view: Yes
- View description: Water
- Has water view: Yes
- Water view: Water
Lot
- Size: 7,501 Square Feet
Details
- Parcel number: 1826160280025000030
Construction
Type & style
- Home type: SingleFamily
Materials
- Concrete Block
- Roof: Tile
Condition
- Year built: 1968
Community & HOA
HOA
- Has HOA: Yes
- HOA fee: $8 monthly
Location
- Region: New Port Richey
Financial & listing details
- Price per square foot: $263/sqft
- Tax assessed value: $392,901
- Annual tax amount: $6,994
Visit our professional directory to find a foreclosure specialist in your area that can help with your home search.
Find a foreclosure agentForeclosure details
Estimated market value
$353,700
$311,000 - $400,000
$2,046/mo
Price history
Price history
| Date | Event | Price |
|---|---|---|
| 4/29/2021 | Sold | $189,000$141/sqft |
Source: Public Record Report a problem | ||
| 7/1/2016 | Sold | $189,000$141/sqft |
Source: Stellar MLS #W7614352 Report a problem | ||
| 6/22/2016 | Pending sale | $189,000$141/sqft |
Source: PITTA AND ASSOC INC #W7614352 Report a problem | ||
| 5/20/2016 | Price change | $189,000-5%$141/sqft |
Source: PITTA AND ASSOC INC #W7614352 Report a problem | ||
| 12/17/2015 | Price change | $199,000-7.9%$148/sqft |
Source: PITTA AND ASSOC INC #W7614352 Report a problem | ||
| 11/20/2015 | Listed for sale | $216,000+28.2%$161/sqft |
Source: PITTA AND ASSOC INC #W7614352 Report a problem | ||
| 4/8/2014 | Listing removed | $900$1/sqft |
Source: SSI Realty #u7602646 Report a problem | ||
| 1/15/2014 | Listed for rent | $900$1/sqft |
Source: SSI Realty #u7602646 Report a problem | ||
| 12/9/2013 | Listing removed | $168,500$125/sqft |
Source: SSI Realty of Tampa Bay LLC #U7602646 Report a problem | ||
| 11/30/2013 | Listed for sale | $168,500+15947.6%$125/sqft |
Source: SSI Realty of Tampa Bay LLC #U7602646 Report a problem | ||
| 7/15/2010 | Listing removed | $1,050$1/sqft |
Source: Prudential Real Estate #7451652 Report a problem | ||
| 3/31/2010 | Price change | $1,050-12.5%$1/sqft |
Source: Prudential Real Estate #7451652 Report a problem | ||
| 2/25/2010 | Listed for sale | $1,200-99.3%$1/sqft |
Source: Prudential Real Estate #7451652 Report a problem | ||
| 12/28/2009 | Sold | $179,000-10.1%$133/sqft |
Source: Public Record Report a problem | ||
| 11/6/2009 | Listed for sale | $199,000+122.1%$148/sqft |
Source: SSI Realty of Tampa Bay, LLC #7436364 Report a problem | ||
| 10/21/2009 | Sold | $89,600-10.4%$67/sqft |
Source: Public Record Report a problem | ||
| 12/21/2000 | Sold | $100,000$74/sqft |
Source: Public Record Report a problem | ||
Public tax history
Public tax history
| Year | Property taxes | Tax assessment |
|---|---|---|
| 2024 | $6,994 +3.7% | $392,901 +2.1% |
| 2023 | $6,744 +21.1% | $384,762 +14.4% |
| 2022 | $5,569 +29.2% | $336,270 +30.9% |
| 2021 | $4,310 +4.1% | $256,867 +4.3% |
| 2020 | $4,140 +4.6% | $246,393 +5.7% |
| 2019 | $3,960 | $233,021 +2.8% |
| 2018 | $3,960 +3.1% | $226,574 +11% |
| 2017 | $3,842 +7.8% | $204,061 +5.3% |
| 2016 | $3,563 +5.9% | $193,785 +3.2% |
| 2015 | $3,364 +5.7% | $187,707 +3.7% |
| 2014 | $3,184 | $180,954 +10.2% |
| 2013 | -- | $164,264 +2.8% |
| 2012 | -- | $159,756 -12.2% |
| 2011 | -- | $181,962 +0.9% |
| 2010 | -- | $180,336 -8.3% |
| 2009 | -- | $196,722 -28.4% |
| 2008 | -- | $274,686 -3.7% |
| 2007 | -- | $285,277 -15.4% |
| 2006 | -- | $337,061 +37.9% |
| 2005 | -- | $244,433 +17.7% |
| 2004 | -- | $207,625 +23.2% |
| 2003 | -- | $168,518 +52.1% |
| 2002 | -- | $110,803 +18.5% |
| 2000 | -- | $93,484 |
| 1999 | -- | $93,484 |
Find assessor info on the county website
Monthly payment
Estimated monthly payment
All calculations are estimates and provided by Zillow, Inc. for informational purposes only. Actual amounts may vary.
HOA fees may include property taxes on listings classified as Co-Ops. Contact the listing agent and/or owner for fee details.
Mortgage interest rates are dependent on a number of factors, including credit score, down payment, and repayment length. Interest rate data provided by Zillow Group Marketplace, Inc. as of 1/1/1970 from various mortgage lenders with which we have lead or other similar arrangements; the Estimated Payment is an average of those rates.
See how much you could borrow to make a competitive offer.
Climate risks
Neighborhood: Flor-A-Mar
Nearby schools
GreatSchools rating
- NAMittye P. Locke Elementary SchoolGrades: PK-5Distance: 1 mi
- 2/10Gulf Middle SchoolGrades: 6-8Distance: 2.2 mi
- 3/10Gulf High SchoolGrades: 9-12Distance: 1.4 mi

- Florida
- Pasco County
- New Port Richey
- 34652
- Flor-A-Mar
- 5003 Pelican Dr
Nearby cities
Nearby neighborhoods
Nearby zip codes
Other New Port Richey Topics
