$178,200
-- bd|-- ba|-- sqft
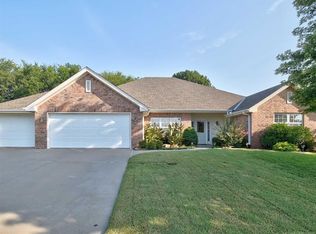
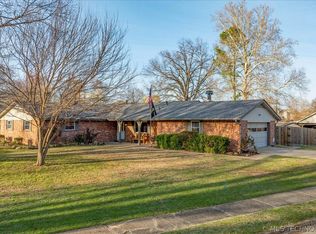
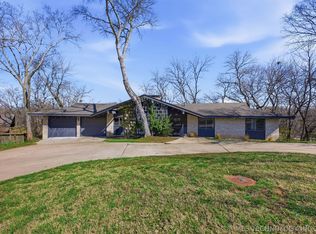
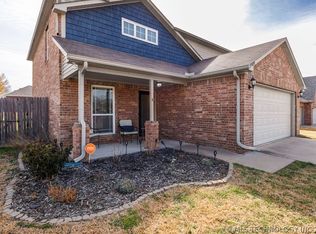
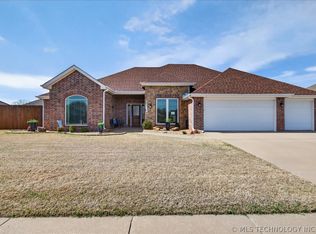
4932 Sefairview Rd, Bartlesville, OK 74004
Off Market
Zillow last checked: 7 hours ago
Listing updated: March 16, 2026 at 08:51am
Carri Ray 918-520-7149,
Trinity Properties
Not available
Estimated sales range
Not available
$2,177/mo
| Date | Event | Price |
|---|---|---|
| 2/12/2026 | Price change | $335,000-1.5%$135/sqft |
Source: | ||
| 1/31/2026 | Listed for sale | $339,999+78.9%$137/sqft |
Source: | ||
| 8/18/2020 | Sold | $190,000-1.6%$77/sqft |
Source: Public Record Report a problem | ||
| 7/2/2020 | Pending sale | $193,100$78/sqft |
Source: Nees Realty LLC #2005449 Report a problem | ||
| 6/23/2020 | Price change | $193,100-4.9%$78/sqft |
Source: Nees Realty LLC #2005449 Report a problem | ||
| 6/15/2020 | Listed for sale | $203,100$82/sqft |
Source: Nees Realty LLC #2005449 Report a problem | ||
| 5/14/2020 | Pending sale | $203,100$82/sqft |
Source: Nees Realty LLC #2005449 Report a problem | ||
| 5/6/2020 | Listed for sale | $203,100$82/sqft |
Source: Nees Realty LLC #2005449 Report a problem | ||
| 4/29/2020 | Pending sale | $203,100$82/sqft |
Source: Nees Realty LLC #2005449 Report a problem | ||
| 3/23/2020 | Price change | $203,100-5%$82/sqft |
Source: Nees Realty LLC #2005449 Report a problem | ||
| 2/20/2020 | Listed for sale | $213,750-6%$86/sqft |
Source: Nees Realty LLC #2005449 Report a problem | ||
| 10/4/2016 | Sold | $227,500-0.9%$92/sqft |
Source: Public Record Report a problem | ||
| 8/19/2016 | Price change | $229,500-3.5%$93/sqft |
Source: RE/MAX Of Bartlesville #1618447 Report a problem | ||
| 5/31/2016 | Listed for sale | $237,900+815%$96/sqft |
Source: RE/MAX Of Bartlesville #1618447 Report a problem | ||
| 5/5/2005 | Sold | $26,000-88.1%$11/sqft |
Source: Public Record Report a problem | ||
| 7/31/2003 | Sold | $218,500$88/sqft |
Source: | ||
| Year | Property taxes | Tax assessment |
|---|---|---|
| 2024 | $3,500 +4% | $30,143 +3% |
| 2023 | $3,366 +2.5% | $29,265 +3% |
| 2022 | $3,284 +2% | $28,413 |
| 2021 | $3,220 +2.4% | $28,413 +4.5% |
| 2020 | $3,144 -5.9% | $27,182 -5.7% |
| 2019 | $3,342 -5.3% | $28,820 -0.1% |
| 2017 | $3,530 | $28,860 |
| 2016 | $3,530 +10.3% | $28,860 |
| 2015 | $3,199 -1.1% | $28,860 |
| 2014 | $3,236 +1.3% | $28,860 |
| 2013 | $3,194 -0.9% | $28,860 |
| 2012 | $3,223 | $28,860 +1.8% |
| 2011 | -- | $28,338 +5% |
| 2010 | -- | $26,988 |
| 2009 | -- | $26,988 |
| 2008 | -- | $26,988 |
| 2007 | -- | $26,988 |
| 2005 | -- | $26,988 |
| 2004 | -- | $26,988 |
Find assessor info on the county website
Source: MLS Technology, Inc.. This data may not be complete. We recommend contacting the local school district to confirm school assignments for this home.