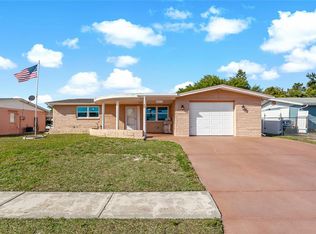
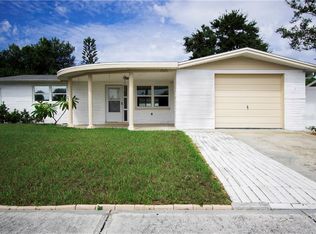
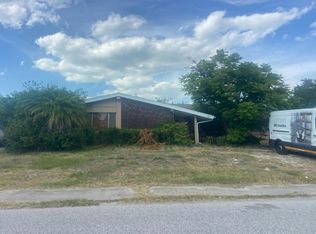
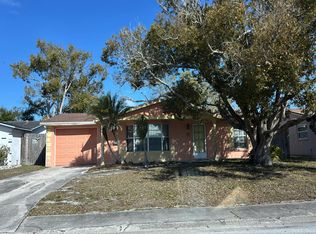
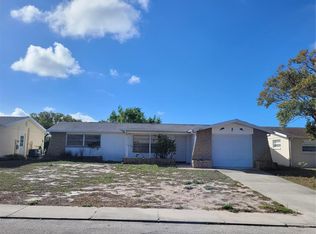
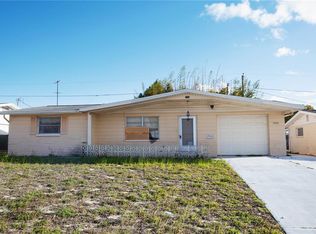
Why pay rent when you can own this charming home. Non-Flood Zone property. Perfect for First Time home buyers or as an investment opportunity. The neighborhood is friendly and welcoming Bedrooms are a comfortable size. Living room/dinning room combo with sliders leading out to Florida Room. Perfect for enjoying sunny afternoons. Extra shower and toilet locaated in garage. Great sized backyard with small shed. Located close to US 19 and downtown New Port Richey. Ceilings painted in 2018. Ac/c was serviced in 2017. Roof was replaced in 2012, new flooring in 2011 and fence replaced in 2008. Great value. Schedule your showing now.
Foreclosed
Est. $203,678
4921 Durney St, New Port Richey, FL 34652
2beds
1,140sqft
SingleFamily
Built in 1972
6,098 Square Feet Lot
$-- Zestimate®
$179/sqft
$-- HOA
Overview
- 35 days |
- 93 |
- 4 |
Facts & features
Interior
Bedrooms & bathrooms
- Bedrooms: 2
- Bathrooms: 2
- Full bathrooms: 1
- 1/2 bathrooms: 1
Heating
- Forced air
Cooling
- Central
Appliances
- Included: Dryer, Microwave, Refrigerator, Washer
Features
- Smoke Alarm(S), Window Treatment, Blinds/Shades, Unfurnished
- Flooring: Carpet
Interior area
- Total interior livable area: 1,140 sqft
Property
Parking
- Parking features: Garage - Attached
Features
- Exterior features: Stucco
Lot
- Size: 6,098 Square Feet
Details
- Parcel number: 1726160630000001080
Construction
Type & style
- Home type: SingleFamily
- Architectural style: Traditional
Materials
- Concrete Block
- Roof: Asphalt
Condition
- Year built: 1972
Utilities & green energy
- Utilities for property: County Water, Street Lights, Public Utilities, Public Sewer, Public Municipal Water, Public Water Available
Community & HOA
Location
- Region: New Port Richey
Financial & listing details
- Price per square foot: $179/sqft
- Tax assessed value: $203,678
- Annual tax amount: $3,086
- Ownership: Fee Simple
Visit our professional directory to find a foreclosure specialist in your area that can help with your home search.
Find a foreclosure agentForeclosure details
Estimated market value
Not available
Estimated sales range
Not available
$1,607/mo
Price history
Price history
| Date | Event | Price |
|---|---|---|
| 2/10/2026 | Sold | $135,000+29.9%$118/sqft |
Source: Public Record Report a problem | ||
| 5/3/2018 | Sold | $103,900+6%$91/sqft |
Source: Public Record Report a problem | ||
| 2/25/2018 | Pending sale | $98,000$86/sqft |
Source: RE/MAX PREMIER GROUP #T2930379 Report a problem | ||
| 2/21/2018 | Listed for sale | $98,000+34.2%$86/sqft |
Source: RE/MAX PREMIER GROUP #T2930379 Report a problem | ||
| 9/12/2008 | Sold | $73,000+5.8%$64/sqft |
Source: Public Record Report a problem | ||
| 9/3/2008 | Listed for sale | $69,000-46.9%$61/sqft |
Source: Century 21 #7355321 Report a problem | ||
| 3/11/2008 | Listing removed | $129,900$114/sqft |
Source: Postlets #7295641 Report a problem | ||
| 1/1/2008 | Listed for sale | $129,900$114/sqft |
Source: Postlets #7295641 Report a problem | ||
Public tax history
Public tax history
| Year | Property taxes | Tax assessment |
|---|---|---|
| 2024 | $3,086 +8.4% | $203,678 +38.6% |
| 2023 | $2,846 +22.7% | $146,960 +10% |
| 2022 | $2,320 +16.4% | $133,600 +21% |
| 2021 | $1,992 +10% | $110,420 +10% |
| 2020 | $1,812 +8.2% | $100,390 +10% |
| 2019 | $1,674 | $91,266 +122.4% |
| 2018 | $1,674 +268.2% | $41,035 |
| 2017 | $455 +2% | $41,035 +4.2% |
| 2016 | $446 +12.8% | $39,364 +0.7% |
| 2015 | $395 +5.1% | $39,090 -8.2% |
| 2014 | $376 | $42,581 +11.4% |
| 2013 | -- | $38,207 +0.7% |
| 2012 | -- | $37,953 -23.3% |
| 2011 | -- | $49,455 -5.2% |
| 2010 | -- | $52,165 -19.5% |
| 2009 | -- | $64,781 -25% |
| 2008 | -- | $86,326 -13.7% |
| 2007 | -- | $100,048 +2% |
| 2006 | -- | $98,126 +35% |
| 2005 | -- | $72,698 +16.8% |
| 2004 | -- | $62,239 +12% |
| 2003 | -- | $55,589 +14.4% |
| 2002 | -- | $48,571 +22% |
| 2000 | -- | $39,801 |
| 1999 | -- | $39,801 |
Find assessor info on the county website
BuyAbility℠ payment
Estimated monthly payment
All calculations are estimates and provided by Zillow, Inc. for informational purposes only. Actual amounts may vary.
HOA fees may include property taxes on listings classified as Co-Ops. Contact the listing agent and/or owner for fee details.
Mortgage interest rates are dependent on a number of factors, including credit score, down payment, and repayment length. Interest rate data provided by Zillow Group Marketplace, Inc. as of 1/1/1970 from various mortgage lenders with which we have lead or other similar arrangements; the Estimated Payment is an average of those rates.
See how much you could borrow to make a competitive offer.
Boost your down payment with 6% savings match
Earn up to a 6% match & get a competitive APY with a *. Zillow has partnered with to help get you home faster.
Learn more*Terms apply. Match provided by Foyer. Account offered by Pacific West Bank, Member FDIC.Climate risks
Neighborhood: Holiday Gardens Estates
Nearby schools
GreatSchools rating
- NAMittye P. Locke Elementary SchoolGrades: PK-5Distance: 0.9 mi
- 2/10Gulf Middle SchoolGrades: 6-8Distance: 1.1 mi
- 3/10Gulf High SchoolGrades: 9-12Distance: 0.3 mi

Nearby cities
Nearby neighborhoods
Nearby zip codes
Other New Port Richey Topics
