$619,800
3 bd|1 ba|1.1k sqft
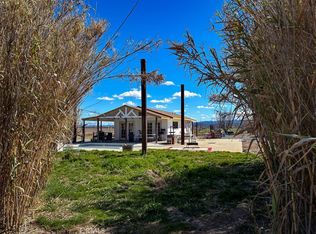
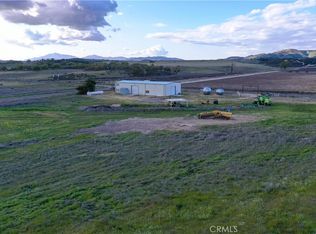
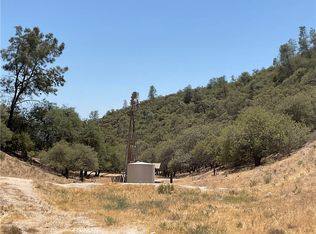
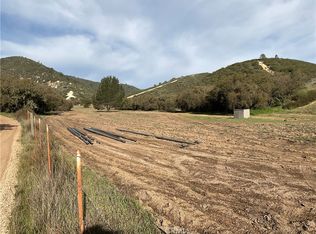
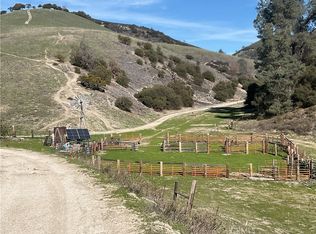
48625 Martinez Rd, Lockwood, CA 93932
Off Market
Zillow last checked: 7 hours ago
Listing updated: March 17, 2026 at 05:18am
Rochelle Hanson-torres 02222772 805-610-0566,
CENTURY 21 Masters 831-648-7271
Not available
Estimated sales range
Not available
$2,467/mo
| Date | Event | Price |
|---|---|---|
| 3/17/2026 | Price change | $980,000-18.3% |
Source: | ||
| 1/2/2026 | Listed for sale | $1,200,000-64.7% |
Source: | ||
| 3/9/2022 | Sold | $3,400,000+115.9% |
Source: Public Record Report a problem | ||
| 6/29/2019 | Listing removed | $1,575,000 |
Source: RE/MAX Parkside Real Estate #NS18292257 Report a problem | ||
| 12/16/2018 | Listed for sale | $1,575,000+75% |
Source: RE/MAX Parkside Real Estate #NS18292257 Report a problem | ||
| 7/10/2014 | Listing removed | $900,000 |
Source: Webber-Nelson, REALTORS #197059 Report a problem | ||
| 6/4/2013 | Listed for sale | $900,000+200% |
Source: Webber-Nelson, REALTORS #197059 Report a problem | ||
| 3/2/2012 | Sold | $300,000-33.2% |
Source: Public Record Report a problem | ||
| 2/16/2012 | Listed for sale | $449,000 |
Source: Remax Parkside Real Estate #179290 Report a problem | ||
| 12/9/2011 | Listing removed | $449,000 |
Source: RE/MAX PARKSIDE REAL ESTATE #179290 Report a problem | ||
| 9/2/2011 | Listed for sale | $449,000-9.3% |
Source: RE/MAX PARKSIDE REAL ESTATE #179290 Report a problem | ||
| 8/11/2011 | Sold | $495,000 |
Source: Public Record Report a problem | ||
| 5/13/2011 | Price change | $495,000-16.8% |
Source: Premier Real Estate #134942 Report a problem | ||
| 5/12/2011 | Listed for sale | $595,000+168.6% |
Source: Premier Real Estate #134942 Report a problem | ||
| 5/21/1996 | Sold | $221,500 |
Source: Public Record Report a problem | ||
| Year | Property taxes | Tax assessment |
|---|---|---|
| 2025 | $41,603 +7.6% | $3,608,106 +2% |
| 2024 | $38,658 +2.4% | $3,537,360 +2% |
| 2023 | $37,742 +293.8% | $3,468,000 +301.4% |
| 2022 | $9,583 +5% | $863,979 +2% |
| 2021 | $9,124 -1.7% | $847,039 +1% |
| 2020 | $9,285 +2.2% | $838,354 +2% |
| 2019 | $9,083 +1.6% | $821,916 +47.3% |
| 2018 | $8,936 | $557,952 +2% |
| 2017 | -- | $547,013 +2% |
| 2016 | -- | $536,288 +1.5% |
| 2015 | -- | $528,234 +2% |
| 2014 | -- | $517,887 +0.5% |
| 2012 | -- | $515,547 -20.6% |
| 2011 | -- | $649,548 +0.8% |
| 2010 | -- | $644,695 -0.2% |
| 2009 | -- | $646,227 +2% |
| 2008 | -- | $633,556 +4.1% |
| 2007 | -- | $608,634 +2% |
| 2006 | -- | $596,700 +2% |
| 2005 | -- | $585,000 |
Find assessor info on the county website
Earn up to a 6% match & get a competitive APY with a *. Zillow has partnered with to help get you home faster.
Learn more*Terms apply. Match provided by Foyer. Account offered by Pacific West Bank, Member FDIC.Source: MLSListings Inc. This data may not be complete. We recommend contacting the local school district to confirm school assignments for this home.