$260,700
2 bd|1 ba|1.4k sqft
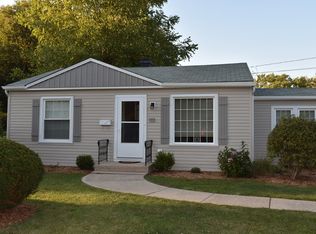
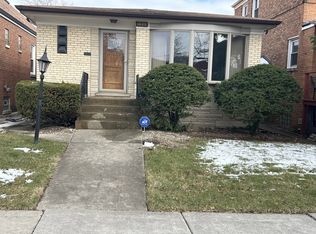
41 N Wisconsin Ave, Addison, IL 60101
Off Market
Zillow last checked: 7 hours ago
Listing updated: March 21, 2026 at 10:43am
Syed Taqvi 815-469-7449,
Real People Realty
$386,100
$367,000 - $405,000
$2,922/mo
| Date | Event | Price |
|---|---|---|
| 3/21/2026 | Contingent | $389,995$257/sqft |
Source: | ||
| 3/2/2026 | Price change | $389,995-2.5%$257/sqft |
Source: | ||
| 2/25/2026 | Listed for sale | $399,995+60.6%$264/sqft |
Source: | ||
| 2/29/2020 | Listing removed | $249,000$164/sqft |
Source: CENTURY 21 Lullo #10505241 Report a problem | ||
| 12/31/2019 | Listed for sale | $249,000$164/sqft |
Source: CENTURY 21 Lullo #10505241 Report a problem | ||
| 12/17/2019 | Pending sale | $249,000$164/sqft |
Source: CENTURY 21 Lullo #10505241 Report a problem | ||
| 11/25/2019 | Listed for sale | $249,000$164/sqft |
Source: CENTURY 21 Lullo #10505241 Report a problem | ||
| 11/12/2019 | Pending sale | $249,000$164/sqft |
Source: CENTURY 21 Lullo #10505241 Report a problem | ||
| 9/28/2019 | Price change | $249,000-3.9%$164/sqft |
Source: CENTURY 21 Lullo #10505241 Report a problem | ||
| 9/4/2019 | Listed for sale | $259,000+17.7%$171/sqft |
Source: Century 21 Lullo #10505241 Report a problem | ||
| 7/29/2019 | Sold | $220,000$145/sqft |
Source: | ||
| 6/6/2019 | Pending sale | $220,000$145/sqft |
Source: CENTURY 21 Lullo #10405613 Report a problem | ||
| 6/5/2019 | Listed for sale | $220,000$145/sqft |
Source: Century 21 Lullo #10405613 Report a problem | ||
| Year | Property taxes | Tax assessment |
|---|---|---|
| 2024 | $6,997 +4.9% | $107,279 +8.8% |
| 2023 | $6,671 +6.5% | $98,620 +8.3% |
| 2022 | $6,263 +4.4% | $91,040 +4.4% |
| 2021 | $5,997 +2.9% | $87,200 +4.4% |
| 2020 | $5,830 +0.8% | $83,520 +4% |
| 2019 | $5,786 +2.1% | $80,310 +5.9% |
| 2018 | $5,668 +2.7% | $75,820 +4.6% |
| 2017 | $5,516 +12.1% | $72,460 +8.3% |
| 2016 | $4,920 +3.6% | $66,900 +8.3% |
| 2015 | $4,749 +5.7% | $61,800 +5.2% |
| 2014 | $4,495 +1.8% | $58,770 -2% |
| 2013 | $4,416 -0.1% | $59,970 -6.4% |
| 2012 | $4,419 -3.3% | $64,040 -10.1% |
| 2011 | $4,567 -11% | $71,240 -18.2% |
| 2010 | $5,130 +1.9% | $87,120 -9.1% |
| 2009 | $5,033 +2.1% | $95,790 |
| 2008 | $4,931 +6.5% | $95,790 +7.6% |
| 2007 | $4,631 +6.5% | $89,020 +5.7% |
| 2006 | $4,350 +7.3% | $84,230 +8% |
| 2005 | $4,053 +5.4% | $77,990 +6.5% |
| 2004 | $3,845 +3.8% | $73,230 +9% |
| 2003 | $3,705 -1.7% | $67,180 +0.8% |
| 2002 | $3,770 +2.8% | $66,620 +8.1% |
| 2001 | $3,668 +4.3% | $61,610 +5.8% |
| 2000 | $3,516 | $58,230 |
Find assessor info on the county website
Source: MRED as distributed by MLS GRID. This data may not be complete. We recommend contacting the local school district to confirm school assignments for this home.