$172,900
2 bd|1 ba|1k sqft
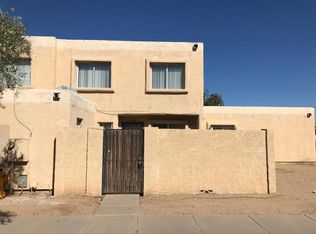
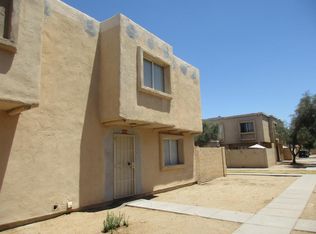
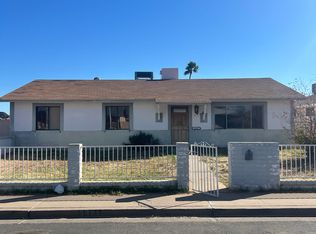
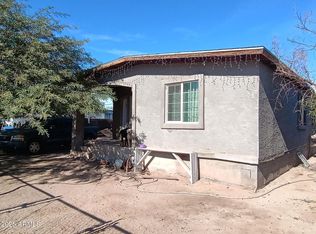
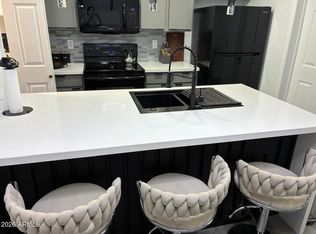
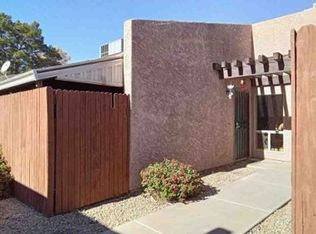
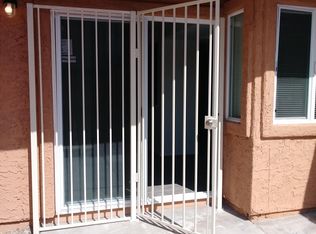
4429 E Riverside St, Phoenix, AZ 85040
Off Market
Zillow last checked: 7 hours ago
Listing updated: March 04, 2026 at 02:20pm
Azroy Salim 480-338-4888,
Realty Executives Arizona Territory

Not available
Estimated sales range
Not available
Not available
| Date | Event | Price |
|---|---|---|
| 3/4/2026 | Listed for sale | $250,000+33.7%$246/sqft |
Source: | ||
| 12/27/2024 | Sold | $187,000-1.3%$184/sqft |
Source: | ||
| 11/30/2024 | Listing removed | $1,275$1/sqft |
Source: Zillow Rentals Report a problem | ||
| 11/17/2024 | Pending sale | $189,500$187/sqft |
Source: | ||
| 10/24/2024 | Listed for sale | $189,500+131.1%$187/sqft |
Source: | ||
| 3/7/2024 | Listed for rent | $1,275+42.5%$1/sqft |
Source: Zillow Rentals Report a problem | ||
| 2/22/2018 | Sold | $82,000+32.3%$81/sqft |
Source: Public Record Report a problem | ||
| 12/29/2017 | Sold | $62,000-47.1%$61/sqft |
Source: Public Record Report a problem | ||
| 12/13/2017 | Listing removed | $895-18.3%$1/sqft |
Source: Zillow Rental Network Report a problem | ||
| 11/30/2017 | Listed for rent | $1,095+75.2%$1/sqft |
Source: Zillow Rental Network #5693311 Report a problem | ||
| 8/5/2016 | Listing removed | $625+5%$1/sqft |
Source: Zillow Rental Network Report a problem | ||
| 7/4/2014 | Listing removed | $595$1/sqft |
Source: Metropolitan Property Management Report a problem | ||
| 5/9/2014 | Listed for rent | $595+8.2%$1/sqft |
Source: Metropolitan Real Estate #5112425 Report a problem | ||
| 1/4/2013 | Listing removed | $550$1/sqft |
Source: Metropolitan RE #4425eriversidest Report a problem | ||
| 6/28/2012 | Listed for rent | $550$1/sqft |
Source: Metropolitan Real Estate #4780519 Report a problem | ||
| 1/9/2007 | Sold | $117,200$115/sqft |
Source: Public Record Report a problem | ||
| Year | Property taxes | Tax assessment |
|---|---|---|
| 2025 | $284 -7.6% | $14,020 -3.2% |
| 2024 | $308 +0.7% | $14,480 +461.5% |
| 2023 | $305 +3.4% | $2,579 -67.4% |
| 2022 | $295 +2.3% | $7,900 +14.8% |
| 2021 | $289 +1.9% | $6,880 +18.6% |
| 2020 | $283 +2.6% | $5,800 +18.4% |
| 2019 | $276 | $4,900 +23.7% |
| 2018 | $276 +3.4% | $3,960 +19.3% |
| 2017 | $267 +7.4% | $3,320 +7.1% |
| 2016 | $249 -7.9% | $3,100 +5.8% |
| 2015 | $270 | $2,930 +27.4% |
| 2014 | -- | $2,300 +58.6% |
| 2013 | -- | $1,450 -6.5% |
| 2012 | -- | $1,550 -31.1% |
| 2011 | -- | $2,250 -47.1% |
| 2010 | -- | $4,250 -50.9% |
| 2009 | -- | $8,650 +4.8% |
| 2008 | -- | $8,250 +101.2% |
| 2007 | -- | $4,100 +17.1% |
| 2006 | -- | $3,500 |
| 2005 | -- | $3,500 -4.1% |
| 2004 | -- | $3,650 |
| 2003 | -- | $3,650 +35.2% |
| 2002 | -- | $2,700 |
Find assessor info on the county website
Source: ARMLS. This data may not be complete. We recommend contacting the local school district to confirm school assignments for this home.