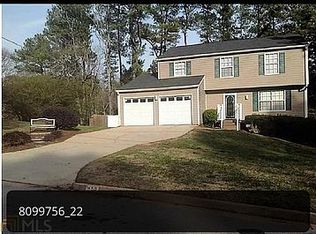
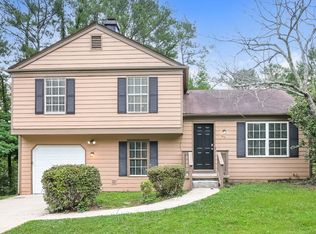
This is a land only in a subdivision. Utilities are connected.
This property is off market, which means it's not currently listed for sale or rent on Zillow. This may be different from what's available on other websites or public sources.
$152,300
$116,000 - $190,000
$1,761/mo
List your home for rent
$1,761/mo
Rent Zestimate®
Find your next renter with Zillow Rental Manager. Plus, with online applications, you can quickly screen prospective tenants – for free.
Learn more$1,761/mo
Rent Zestimate®
Refinance and save
$955/mo
Est. payment
Refinancing to a lower rate could help reduce your monthly payments and save thousands over the life of the loan.
See today's rates$955/mo
Est. payment
Work with a Zillow partner agent
Leverage their expertise and Zillow's premium Showcase listings to get your home seen by more buyers.
Get startedList with your own agent
Get your home in front of millions of buyers by listing it on Zillow.
Learn how to do itSell it yourself
Take full control of how buyers see your home on Zillow by listing For Sale by Owner (FSBO).
List your homeThis is a land only in a subdivision. Utilities are connected.
This property is off market, which means it's not currently listed for sale or rent on Zillow. This may be different from what's available on other websites or public sources.
| Date | Event | Price |
|---|---|---|
| 6/23/2020 | Sold | $24,000-10.8%$15/sqft |
Source: Public Record Report a problem | ||
| 3/3/2020 | Listed for sale | $26,900$17/sqft |
Source: Virtual Properties Realty.com #6689996 Report a problem | ||
| 11/5/2019 | Listing removed | $26,900$17/sqft |
Source: Virtual Properties Realty.com #6106592 Report a problem | ||
| 10/4/2019 | Listed for sale | $26,900-10%$17/sqft |
Source: Virtual Properties Realty.com #6106592 Report a problem | ||
| 12/2/2018 | Listing removed | $29,900$18/sqft |
Source: Owner Report a problem | ||
| 11/19/2018 | Listed for sale | $29,900+99.3%$18/sqft |
Source: Owner Report a problem | ||
| 6/5/2018 | Sold | $15,000-25%$9/sqft |
Source: Public Record Report a problem | ||
| 5/16/2018 | Pending sale | $20,000$12/sqft |
Source: Owners.com #8354693 Report a problem | ||
| 1/3/2018 | Listed for sale | $20,000-20%$12/sqft |
Source: Century 21 Results Realty Svcs #8304613 Report a problem | ||
| 11/9/2017 | Listing removed | $25,000$15/sqft |
Source: CENTURY 21 Results Realty Services #5891734 Report a problem | ||
| 10/10/2017 | Price change | $25,000-50%$15/sqft |
Source: CENTURY 21 Results Realty Services #5891734 Report a problem | ||
| 8/9/2017 | Listed for sale | $50,000-41.1%$31/sqft |
Source: CENTURY 21 RESULTS REALTY SERVICES #5891734 Report a problem | ||
| 2/2/2015 | Listing removed | $84,900$52/sqft |
Source: LENOX REALTY GROUP LLC #5330750 Report a problem | ||
| 1/10/2015 | Price change | $84,900-1.2%$52/sqft |
Source: LENOX REALTY GROUP LLC #5330750 Report a problem | ||
| 12/19/2014 | Price change | $85,900-1.8%$53/sqft |
Source: LENOX REALTY GROUP LLC #5330750 Report a problem | ||
| 11/11/2014 | Price change | $87,500-0.5%$54/sqft |
Source: LENOX REALTY GROUP LLC #5330750 Report a problem | ||
| 9/17/2014 | Price change | $87,900-2.2%$54/sqft |
Source: LENOX REALTY GROUP LLC #5330750 Report a problem | ||
| 8/13/2014 | Listing removed | $925$1/sqft |
Source: Bella Management, LLC. Report a problem | ||
| 8/13/2014 | Listed for sale | $89,900+41%$56/sqft |
Source: LENOX REALTY GROUP LLC #5330750 Report a problem | ||
| 7/24/2014 | Listed for rent | $925$1/sqft |
Source: Bella Management, LLC. Report a problem | ||
| 10/24/2011 | Sold | $63,750+244.6%$39/sqft |
Source: Public Record Report a problem | ||
| 6/28/2011 | Sold | $18,501-74.3%$11/sqft |
Source: Public Record Report a problem | ||
| 8/19/1994 | Sold | $72,000$44/sqft |
Source: Public Record Report a problem | ||
| Year | Property taxes | Tax assessment |
|---|---|---|
| 2025 | $896 +1.2% | $16,200 |
| 2024 | $885 +1.2% | $16,200 |
| 2023 | $875 +23.1% | $16,200 +19.8% |
| 2022 | $711 +31.9% | $13,520 +40.8% |
| 2021 | $539 -1% | $9,600 -1.2% |
| 2020 | $544 +42.9% | $9,720 +62% |
| 2019 | $381 -30.1% | $6,000 -83.5% |
| 2018 | $545 -66.1% | $36,400 +35% |
| 2017 | $1,609 +2.2% | $26,960 |
| 2016 | $1,574 | $26,960 +6.1% |
| 2014 | $1,574 | $25,400 +44% |
| 2013 | -- | $17,640 -40.5% |
| 2012 | -- | $29,640 +53.6% |
| 2011 | -- | $19,296 -50.6% |
| 2010 | $1,266 | $39,040 |
| 2009 | $1,266 -3.6% | $39,040 -20.6% |
| 2008 | $1,313 -0.1% | $49,160 |
| 2007 | $1,314 | $49,160 |
| 2006 | $1,314 +19% | $49,160 +10.4% |
| 2005 | $1,104 +1.6% | $44,520 |
| 2004 | $1,087 +3.3% | $44,520 +3.5% |
| 2003 | $1,052 +19.5% | $43,000 +5.3% |
| 2002 | $881 +32.4% | $40,840 |
| 2001 | $665 | $40,840 |
Find assessor info on the county website
Source: The MLS. This data may not be complete. We recommend contacting the local school district to confirm school assignments for this home.