$--
2 bd|1 ba|1.1k sqft
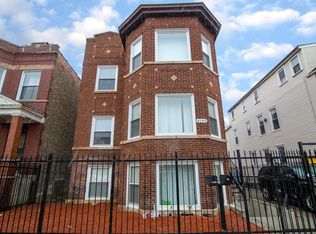
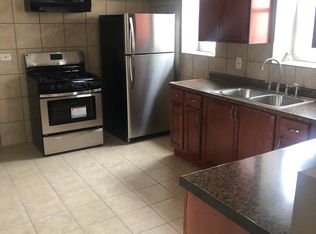
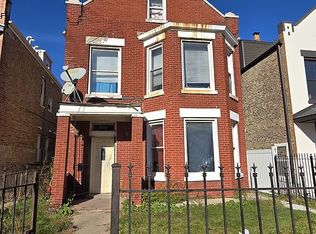
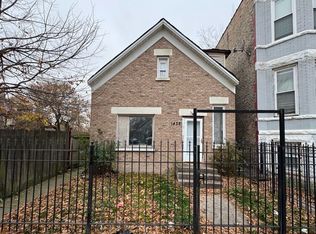
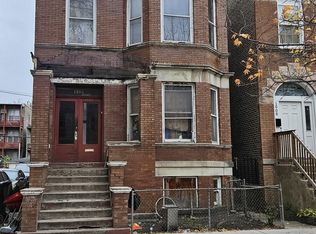
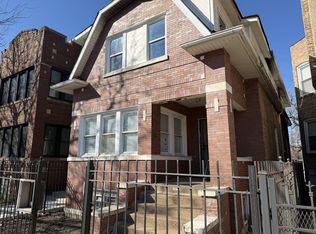
4149 W Cermak Rd #1, Chicago, IL 60623
Off Market
Zillow last checked: 7 hours ago
Listing updated: March 04, 2026 at 10:07pm
David Geary 847-234-2040,
Geary's Realty LLC
Not available
Estimated sales range
Not available
Not available
| Date | Event | Price |
|---|---|---|
| 2/27/2026 | Price change | $199,900-11.1% |
Source: | ||
| 1/9/2026 | Listed for sale | $224,900-5.3% |
Source: | ||
| 1/1/2026 | Listing removed | $237,500 |
Source: | ||
| 11/24/2025 | Price change | $237,500-5% |
Source: | ||
| 10/23/2025 | Listed for sale | $250,000-17.8% |
Source: | ||
| 6/16/2021 | Listing removed | -- |
Source: | ||
| 3/24/2021 | Listed for sale | $304,000 |
Source: | ||
| 3/12/2021 | Contingent | $304,000 |
Source: | ||
| 3/1/2021 | Price change | $304,000-3.2% |
Source: | ||
| 2/16/2021 | Listed for sale | $314,000 |
Source: | ||
| 2/6/2021 | Contingent | $314,000 |
Source: | ||
| 2/1/2021 | Listed for sale | $314,000 |
Source: | ||
| 12/15/2020 | Pending sale | $314,000 |
Source: | ||
| 10/31/2020 | Listed for sale | $314,000+349.2% |
Source: Homesmart Connect LLC #10922053 Report a problem | ||
| 6/4/2020 | Listing removed | $69,900 |
Source: Re/Max Properties #10638029 Report a problem | ||
| 6/4/2020 | Listed for sale | $69,900-1.6% |
Source: Re/Max Properties #10638029 Report a problem | ||
| 6/3/2020 | Sold | $71,001+1.6% |
Source: | ||
| 4/2/2020 | Pending sale | $69,900 |
Source: Re/Max Properties #10638029 Report a problem | ||
| 3/27/2020 | Price change | $69,900-12.5% |
Source: Re/Max Properties #10638029 Report a problem | ||
| 3/24/2020 | Listed for sale | $79,900+22.9% |
Source: Re/Max Properties #10638029 Report a problem | ||
| 5/29/2019 | Sold | $65,000-35% |
Source: Public Record Report a problem | ||
| 11/17/2004 | Sold | $100,000+66.7% |
Source: Public Record Report a problem | ||
| 10/4/2004 | Sold | $60,000 |
Source: Public Record Report a problem | ||
| Year | Property taxes | Tax assessment |
|---|---|---|
| 2023 | $1,270 +2.6% | $5,997 |
| 2022 | $1,238 +2.3% | $5,997 |
| 2021 | $1,210 -56.4% | $5,997 -51.7% |
| 2020 | $2,777 -3.5% | $12,424 -13% |
| 2019 | $2,879 +1.7% | $14,281 |
| 2018 | $2,830 -28.1% | $14,281 -21.6% |
| 2017 | $3,936 +7.8% | $18,222 |
| 2016 | $3,650 +9.3% | $18,222 |
| 2015 | $3,339 +3.5% | $18,222 +4.8% |
| 2014 | $3,227 +2% | $17,391 |
| 2013 | $3,163 +1.4% | $17,391 |
| 2012 | $3,121 -16.2% | $17,391 -24.3% |
| 2011 | $3,723 -0.4% | $22,974 |
| 2010 | $3,738 +4.4% | $22,974 |
| 2009 | $3,582 +11.2% | $22,974 +2.3% |
| 2008 | $3,221 +1% | $22,452 |
| 2007 | $3,189 -1.1% | $22,452 |
| 2006 | $3,223 +66.8% | $22,452 +89.8% |
| 2005 | $1,933 +1% | $11,828 |
| 2004 | $1,913 +2.2% | $11,828 |
| 2003 | $1,872 +35% | $11,828 +53.3% |
| 2002 | $1,386 +40.6% | $7,716 |
| 2001 | $986 -5.1% | $7,716 |
| 2000 | $1,038 | $7,716 +42.8% |
| 1999 | -- | $5,405 |
Find assessor info on the county website
Source: MRED as distributed by MLS GRID. This data may not be complete. We recommend contacting the local school district to confirm school assignments for this home.