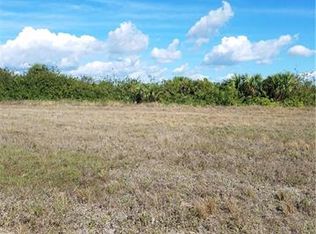
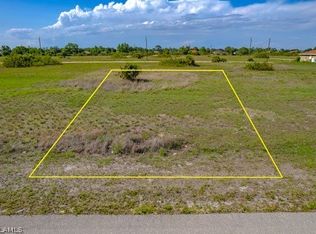
Fresh Water Lot!! Located in the area of NW Cape Coral with E exposure. Build your dream home on this beautiful site or use it simply as great investment opportunity
Active
$43,500
4115 Old Burnt Store Rd N, Cape Coral, FL 33993
--beds
--baths
10,018.8Square Feet
Unimproved Land
Built in ----
10,018.8 Square Feet Lot
$-- Zestimate®
$--/sqft
$-- HOA
What's special
With e exposureFresh water lot
- 114 days |
- 7 |
- 0 |
Zillow last checked:
Listing updated:
Listed by:
Herbert Putz 239-340-2405,
Gigahomes Real Estate
Source: Florida Gulf Coast MLS,MLS#: 2025025522 Originating MLS: Florida Gulf Coast
Facts & features
Property
Features
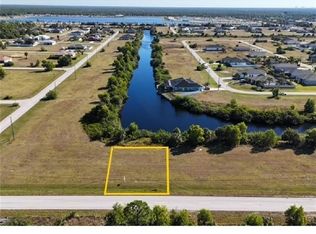
- Has view: Yes
- View description: Canal
- Has water view: Yes
- Water view: Canal
- Waterfront features: Canal Access
Lot
- Size: 10,018.8 Square Feet
- Dimensions: 80 x 125 x 80 x 125
- Features: Rectangular Lot
Details
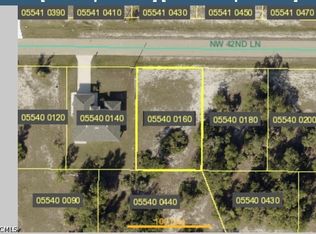
- Parcel number: 184323C105494.0060
- Lease amount: $0
- Zoning description: R1-W
Utilities & green energy
- Sewer: None
- Water: None
- Utilities for property: None, Sewer Not Available, Water Not Available
Community & HOA
Community
- Features: Non-Gated
- Condo and coop fee: $0
- Membership fee: $0
- Senior community: Yes
- Subdivision: CAPE CORAL
HOA
- Services included: None
Location
- Region: Cape Coral
Financial & listing details
- Tax assessed value: $29,070
- Annual tax amount: $957
- Date on market: 12/20/2025
- Cumulative days on market: 28 days
- Listing terms: All Financing Considered,Cash
- Road surface type: Paved
Estimated market value
Not available
Estimated sales range
Not available
$2,286/mo
Price history
Price history
| Date | Event | Price |
|---|---|---|
| 12/20/2025 | Listed for sale | $43,500-11.2% |
Source: | ||
| 2/5/2024 | Listing removed | -- |
Source: | ||
| 11/11/2023 | Listed for sale | $49,000+8.9% |
Source: | ||
| 2/10/2022 | Sold | $45,000+143.3% |
Source: Public Record Report a problem | ||
| 11/9/2018 | Listing removed | $18,499 |
Source: Gigahomes Real Estate #218041069 Report a problem | ||
| 8/20/2018 | Listed for sale | $18,499+107.9% |
Source: Gigahomes Real Estate #218041069 Report a problem | ||
| 4/25/2018 | Listing removed | $8,900 |
Source: Cape Premier Realty LLC #218023142 Report a problem | ||
| 4/24/2018 | Pending sale | $8,900+4.7% |
Source: Cape Premier Realty LLC #218023142 Report a problem | ||
| 4/20/2018 | Sold | $8,500-4.5% |
Source: | ||
| 3/24/2018 | Listed for sale | $8,900-55.3% |
Source: Cape Premier Realty LLC #218023142 Report a problem | ||
| 9/4/2017 | Listing removed | $19,900 |
Source: Cape Realty Inc #216058353 Report a problem | ||
| 9/18/2016 | Listed for sale | $19,900 |
Source: Cape Realty Inc #216058353 Report a problem | ||
| 3/7/2016 | Listing removed | $19,900 |
Source: Cape Realty Inc #215033797 Report a problem | ||
| 6/5/2015 | Listed for sale | $19,900+20.6% |
Source: Cape Realty Inc #215033797 Report a problem | ||
| 2/19/1996 | Sold | $16,500 |
Source: Public Record Report a problem | ||
Public tax history
Public tax history
| Year | Property taxes | Tax assessment |
|---|---|---|
| 2025 | $1,026 +7.2% | $29,070 -1.8% |
| 2024 | $957 -26.9% | $29,617 -45.7% |
| 2023 | $1,309 +102.3% | $54,539 +329.3% |
| 2022 | $647 +16.9% | $12,705 +10% |
| 2021 | $553 +7.4% | $11,550 +10% |
| 2020 | $515 +6% | $10,500 +5% |
| 2019 | $486 | $10,000 |
| 2018 | $486 +4% | $10,000 -10.9% |
| 2017 | $467 +5.3% | $11,224 +18.1% |
| 2016 | $444 +9.7% | $9,500 -13.6% |
| 2015 | $405 +4.6% | $11,000 +10% |
| 2014 | $387 +19.6% | $10,000 +88.7% |
| 2013 | $323 +54.4% | $5,300 +10.4% |
| 2012 | $209 -3.6% | $4,800 -9.4% |
| 2011 | $217 -25% | $5,300 -36.1% |
| 2010 | $290 -31.4% | $8,300 -44.7% |
| 2009 | $422 -8.6% | $15,000 -34.8% |
| 2008 | $462 -48.7% | $23,000 -52.1% |
| 2007 | $900 -58.1% | $48,000 -58.6% |
| 2006 | $2,150 +479.9% | $116,000 +648.4% |
| 2004 | $371 +80% | $15,500 +101.8% |
| 2003 | $206 +91.9% | $7,680 +133.4% |
| 2002 | $107 | $3,290 -12.5% |
| 2000 | -- | $3,760 |
Find assessor info on the county website
Monthly payment
Estimated monthly payment
All calculations are estimates and provided by Zillow, Inc. for informational purposes only. Actual amounts may vary.
HOA fees may include property taxes on listings classified as Co-Ops. Contact the listing agent and/or owner for fee details.
Mortgage interest rates are dependent on a number of factors, including credit score, down payment, and repayment length. Interest rate data provided by Zillow Group Marketplace, Inc. as of 1/1/1970 from various mortgage lenders with which we have lead or other similar arrangements; the Estimated Payment is an average of those rates.
See how much you could borrow to make a competitive offer.
Climate risks
Neighborhood: 33993
Nearby schools
GreatSchools rating
- 2/10Hector A. Cafferata Jr Elementary SchoolGrades: PK-5Distance: 7.3 mi
- 3/10Mariner Middle SchoolGrades: 6-8Distance: 5.9 mi
- 3/10Mariner High SchoolGrades: 9-12Distance: 5.7 mi
A local agent can set up tours, give advice and negotiate with sellers.


- Florida
- Lee County
- Cape Coral
- 33993
- 4115 Old Burnt Store Rd N
Nearby cities
Nearby neighborhoods
Nearby zip codes
Other Cape Coral Topics
