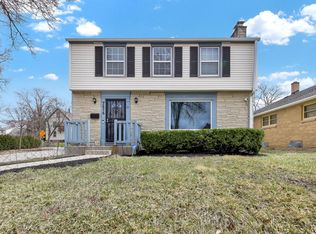
NEWLY UPDATED 4 BEDROOM CAPE COD. MANY AMENITIES TO CHOOSE FROM. THE KITCHEN HAS A BUILT IN BREAKFAST NOOK, ATTACHED TO NEW MODERN CABINETS WITH QUARTZ COUNTERTOP. FEEL COMFORTABLE WALKIN ON NEW CARPET THROUGHOUT THE HOME. RELAX IN A LOWER REC ROOM. ENJOY THE BACKYARD FIRE-PIT ON COOL NIGHTS. LOCATED WITHIN WALKING DISTANCE OF JOHN MARSHALL HIGH SCHOOL. BOOK A SHOWING TODAY. THIS BEAUTY WILL NOT LAST LONG.
Pre-foreclosure
Est. $240,700
4100 N 62nd St, Milwaukee, WI 53216
4beds
2,000sqft
SingleFamily
Built in 1955
5,227 Square Feet Lot
$240,700 Zestimate®
$120/sqft
$-- HOA
Overview
- 71 days |
- 14 |
- 0 |
Facts & features
Interior
Bedrooms & bathrooms
- Bedrooms: 4
- Bathrooms: 2
- Full bathrooms: 1
- 1/2 bathrooms: 1
Heating
- Forced air, Electric, Gas
Cooling
- Central
Appliances
- Included: Range / Oven, Refrigerator
Features
- Basement: Partially finished
Interior area
- Total interior livable area: 2,000 sqft
Property
Parking
- Total spaces: 2
- Parking features: Garage - Detached
Accessibility
- Accessibility features: Bedroom on Main Level, Full Bath on Main Level
Features
- Exterior features: Stone
- Fencing: Fenced
Lot
- Size: 5,227 Square Feet
- Features: Corner Lot, Sidewalk, Near Public Transit
Details
- Parcel number: 2500308000
Construction
Type & style
- Home type: SingleFamily
- Architectural style: CAPE COD
Condition
- Year built: 1955
Utilities & green energy
- Gas: Natural Gas
Community & HOA
Location
- Region: Milwaukee
Financial & listing details
- Price per square foot: $120/sqft
- Tax assessed value: $174,400
- Annual tax amount: $3,826
Visit our professional directory to find a foreclosure specialist in your area that can help with your home search.
Find a foreclosure agentForeclosure details
Estimated market value
$240,700
$224,000 - $255,000
$1,991/mo
Price history
Price history
| Date | Event | Price |
|---|---|---|
| 7/9/2020 | Sold | $172,500+8.5%$86/sqft |
Source: Public Record Report a problem | ||
| 4/16/2020 | Listed for sale | $159,000+103.1%$80/sqft |
Source: Lloyd and Bobolink Realty LLC #1685068 Report a problem | ||
| 1/14/2020 | Sold | $78,300-32.2%$39/sqft |
Source: Public Record Report a problem | ||
| 12/4/2019 | Price change | $115,466+51.4%$58/sqft |
Source: Auction.com Report a problem | ||
| 12/1/2019 | Price change | $76,276-0.2%$38/sqft |
Source: Auction.com Report a problem | ||
| 11/30/2019 | Price change | $76,398-0.2%$38/sqft |
Source: Auction.com Report a problem | ||
| 11/27/2019 | Price change | $76,5630%$38/sqft |
Source: Auction.com Report a problem | ||
| 11/25/2019 | Price change | $76,583-0.1%$38/sqft |
Source: Auction.com Report a problem | ||
| 11/23/2019 | Price change | $76,697+0.1%$38/sqft |
Source: Auction.com Report a problem | ||
| 11/20/2019 | Price change | $76,589+0.2%$38/sqft |
Source: Auction.com Report a problem | ||
| 11/13/2019 | Price change | $76,436-2.4%$38/sqft |
Source: Auction.com Report a problem | ||
| 11/10/2019 | Listed for sale | -- |
Source: Auction.com Report a problem | ||
| 11/8/2019 | Sold | $78,280-40.9%$39/sqft |
Source: Public Record Report a problem | ||
| 2/9/2006 | Sold | $132,500$66/sqft |
Source: Public Record Report a problem | ||
Public tax history
Public tax history
| Year | Property taxes | Tax assessment |
|---|---|---|
| 2022 | $3,826 +11.1% | $160,700 +29.8% |
| 2021 | $3,445 | $123,800 |
| 2020 | $3,445 +12.1% | $123,800 +12.1% |
| 2019 | $3,072 +6% | $110,400 +6.1% |
| 2018 | $2,899 -5.4% | $104,100 +16.7% |
| 2017 | $3,066 -0.9% | $89,200 +1.1% |
| 2016 | $3,095 +7.8% | $88,200 +5.1% |
| 2015 | $2,870 | $83,900 |
| 2014 | $2,870 | $83,900 -3% |
| 2012 | -- | $86,500 -14.9% |
| 2011 | -- | $101,600 |
| 2010 | $2,532 -3.4% | $101,600 -5% |
| 2009 | $2,621 | $106,900 -14.9% |
| 2008 | -- | $125,600 |
| 2007 | -- | $125,600 |
| 2006 | -- | $125,600 |
| 2005 | -- | $125,600 +14% |
| 2004 | -- | $110,200 +28.7% |
| 2003 | -- | $85,600 +7.8% |
| 2002 | -- | $79,400 +10.4% |
| 2001 | $1,977 +5.3% | $71,900 |
| 2000 | $1,878 +8.2% | $71,900 +16.5% |
| 1999 | $1,736 | $61,700 |
Find assessor info on the county website
Monthly payment
Estimated monthly payment
All calculations are estimates and provided by Zillow, Inc. for informational purposes only. Actual amounts may vary.
HOA fees may include property taxes on listings classified as Co-Ops. Contact the listing agent and/or owner for fee details.
Mortgage interest rates are dependent on a number of factors, including credit score, down payment, and repayment length. Interest rate data provided by Zillow Group Marketplace, Inc. as of 1/1/1970 from various mortgage lenders with which we have lead or other similar arrangements; the Estimated Payment is an average of those rates.
See how much you could borrow to make a competitive offer.
Climate risks
Neighborhood: Capitol Heights
Nearby schools
GreatSchools rating
- 3/10Carson Academy of ScienceGrades: PK-8Distance: 0.7 mi
- 3/10Milwaukee School of LanguagesGrades: 6-12Distance: 1.9 mi
- 6/10Craig Montessori SchoolGrades: PK-8Distance: 1 mi
Schools provided by the listing agent
- District: Milwaukee
Source: The MLS. This data may not be complete. We recommend contacting the local school district to confirm school assignments for this home.
- Wisconsin
- Milwaukee County
- Milwaukee
- 53216
- Capitol Heights
- 4100 N 62nd St
Nearby cities
Nearby neighborhoods
Nearby zip codes
Other Milwaukee Topics
