$196,200
2 bd|1 ba|1.1k sqft
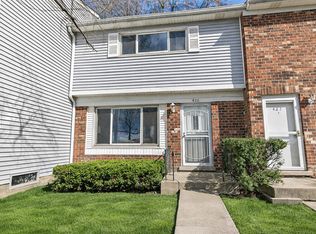
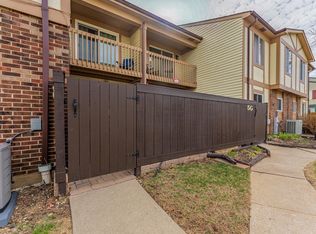
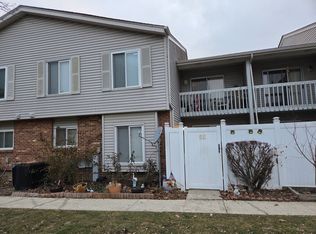
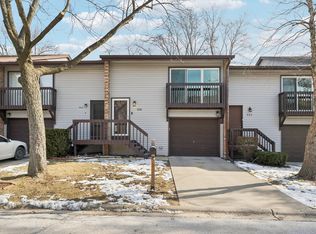
410 Colony Ct, Bolingbrook, IL 60440
Off Market
Likely to sell faster than
Zillow last checked: 7 hours ago
Listing updated: March 11, 2026 at 03:38pm
Erica Rivera 708-788-1900,
Realty of America, LLC
Not available
Estimated sales range
Not available
Not available
| Date | Event | Price |
|---|---|---|
| 3/11/2026 | Contingent | $209,200$178/sqft |
Source: | ||
| 3/6/2026 | Listed for sale | $209,200+23.1%$178/sqft |
Source: | ||
| 12/13/2021 | Sold | $170,000$145/sqft |
Source: | ||
| 11/6/2021 | Pending sale | $170,000$145/sqft |
Source: | ||
| 11/6/2021 | Contingent | $170,000$145/sqft |
Source: | ||
| 11/3/2021 | Listed for sale | $170,000+13.4%$145/sqft |
Source: | ||
| 7/30/2019 | Listing removed | $149,900$127/sqft |
Source: RE/MAX of Naperville #10340793 Report a problem | ||
| 7/30/2019 | Listed for sale | $149,900-0.1%$127/sqft |
Source: RE/MAX of Naperville #10340793 Report a problem | ||
| 7/26/2019 | Sold | $150,000+0.1%$128/sqft |
Source: | ||
| 7/23/2019 | Pending sale | $149,900$127/sqft |
Source: RE/MAX of Naperville #10340793 Report a problem | ||
| 7/22/2019 | Listed for sale | $149,900$127/sqft |
Source: RE/MAX of Naperville #10340793 Report a problem | ||
| 7/3/2019 | Pending sale | $149,900$127/sqft |
Source: RE/MAX of Naperville #10340793 Report a problem | ||
| 6/14/2019 | Listed for sale | $149,900$127/sqft |
Source: RE/MAX of Naperville #10340793 Report a problem | ||
| 5/6/2019 | Pending sale | $149,900$127/sqft |
Source: RE/MAX of Naperville #10340793 Report a problem | ||
| 4/11/2019 | Listed for sale | $149,900+145.7%$127/sqft |
Source: RE/MAX of Naperville #10340793 Report a problem | ||
| 1/24/2019 | Sold | $61,000+8%$52/sqft |
Source: Public Record Report a problem | ||
| 4/13/1999 | Sold | $56,500$48/sqft |
Source: Public Record Report a problem | ||
| Year | Property taxes | Tax assessment |
|---|---|---|
| 2023 | $3,197 +11.5% | $40,961 +17% |
| 2022 | $2,867 -10.4% | $35,004 +10.2% |
| 2021 | $3,199 +6% | $31,775 +6.5% |
| 2020 | $3,018 +37.2% | $29,835 +9.2% |
| 2019 | $2,200 +19.5% | $27,322 +15.2% |
| 2018 | $1,841 +13.9% | $23,722 +10.8% |
| 2017 | $1,616 +10.6% | $21,414 +9.3% |
| 2016 | $1,461 +13.4% | $19,600 +11.4% |
| 2015 | $1,287 | $17,600 |
| 2014 | $1,287 -14.6% | $17,600 -12% |
| 2013 | $1,508 -1% | $20,000 -6.5% |
| 2012 | $1,524 -8.5% | $21,400 -15.4% |
| 2011 | $1,664 -36.2% | $25,300 -36.1% |
| 2010 | $2,608 -0.7% | $39,600 -5% |
| 2009 | $2,627 +5.4% | $41,700 |
| 2008 | $2,491 | $41,700 +4% |
| 2007 | -- | $40,100 +5% |
| 2006 | $2,338 +6.3% | $38,200 +10.1% |
| 2005 | $2,199 +11% | $34,700 +9.8% |
| 2004 | $1,981 +17.8% | $31,600 +20.6% |
| 2003 | $1,683 +10.7% | $26,200 +14.9% |
| 2002 | $1,520 -4.7% | $22,800 |
| 2001 | $1,594 +33.4% | $22,800 +21.9% |
| 2000 | $1,195 | $18,700 |
Find assessor info on the county website
Source: MRED as distributed by MLS GRID. This data may not be complete. We recommend contacting the local school district to confirm school assignments for this home.