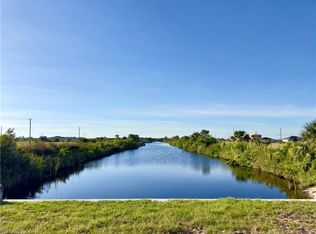
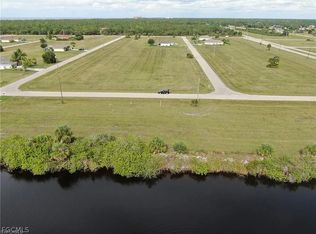
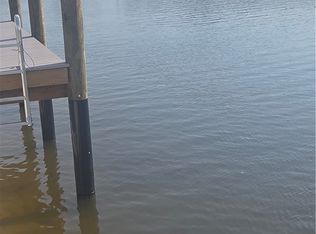
Don's miss out on this incredible opportunity to own a beautiful oversized lot! This freshwater canal property features a newly installed seawall and is situated in a rapidly growing area near the Pine island Road corridor. Enjoy the convenience of being close to restaurants, shops, parks, and schools. Plus, you'll have quick access to Matlacha Island, Burnt Store Road Marina, Charlotte Harbor Preserve State Park, Crystal Lake Park, and upcoming Seven Islands development project. Seize your chance to invest in this prime location today!
Active
$139,900
4003 Old Burnt Store Rd N, Cape Coral, FL 33993
--beds
--baths
0.38Acres
Unimproved Land
Built in ----
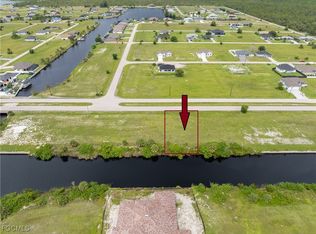
0.38 Acres Lot
$-- Zestimate®
$--/sqft
$-- HOA
What's special
Freshwater canal propertyBeautiful oversized lotNewly installed seawall
- 26 days |
- 58 |
- 0 |
Zillow last checked: 7 hours ago
Listing updated: March 13, 2026 at 08:47am
Listed by:
Mareilys Cabrera 239-288-9771,
Starlink Realty, Inc
Source: Florida Gulf Coast MLS,MLS#: 2026012549 Originating MLS: Florida Gulf Coast
Facts & features
Interior
Video & virtual tour
Property
Features
- Has view: Yes
- View description: Canal
- Has water view: Yes
- Water view: Canal
Lot
- Size: 0.38 Acres
- Dimensions: 147 x 129 x 115 x 125
- Features: Oversized Lot
Details
- Parcel number: 184323C405492.0160
- Lease amount: $0
- Zoning description: R1-W
Utilities & green energy
- Sewer: None
- Water: Public
- Utilities for property: None, Sewer Not Available
Community & HOA
Community
- Features: Non-Gated
- Condo and coop fee: $0
- Membership fee: $0
- Subdivision: CAPE CORAL
HOA
- Services included: None
Location
- Region: Cape Coral
Financial & listing details
- Tax assessed value: $37,791
- Annual tax amount: $1,330
- Date on market: 3/13/2026
- Cumulative days on market: 204 days
- Listing terms: Cash
Estimated market value
Not available
Estimated sales range
Not available
Not available
Price history
Price history
| Date | Event | Price |
|---|---|---|
| 3/13/2026 | Listed for sale | $139,900+5.2% |
Source: | ||
| 3/4/2026 | Listing removed | $133,000 |
Source: | ||
| 1/16/2026 | Price change | $133,000-5% |
Source: | ||
| 9/3/2025 | Listed for sale | $140,000+250% |
Source: | ||
| 9/26/2022 | Sold | $40,000-11.1% |
Source: | ||
| 9/6/2022 | Pending sale | $45,000 |
Source: | ||
| 8/25/2022 | Listed for sale | $45,000 |
Source: | ||
| 8/2/2022 | Pending sale | $45,000 |
Source: | ||
| 7/27/2022 | Listed for sale | $45,000-70.6% |
Source: | ||
| 7/12/2005 | Sold | $153,000 |
Source: Public Record Report a problem | ||
Public tax history
Public tax history
| Year | Property taxes | Tax assessment |
|---|---|---|
| 2025 | $1,296 -2.6% | $37,791 -16.6% |
| 2024 | $1,331 -12.3% | $45,319 -24.5% |
| 2023 | $1,517 +92.1% | $59,995 +338.1% |
| 2022 | $790 +15.2% | $13,695 +10% |
| 2021 | $686 +7.7% | $12,450 +10% |
| 2020 | $636 +7.7% | $11,318 +2.9% |
| 2019 | $591 | $11,000 |
| 2018 | $591 +1.5% | $11,000 -13.2% |
| 2017 | $582 +5.8% | $12,678 +21.3% |
| 2016 | $551 +10.9% | $10,450 -13.6% |
| 2015 | $497 +5.7% | $12,100 +10% |
| 2014 | $470 +1% | $11,000 +61.8% |
| 2013 | $465 +63.8% | $6,800 +28.8% |
| 2012 | $284 -2.1% | $5,280 -9.4% |
| 2011 | $290 -22.2% | $5,830 -36.1% |
| 2010 | $373 -27.8% | $9,130 -44.7% |
| 2009 | $517 -4.2% | $16,500 -34.8% |
| 2008 | $539 -51.2% | $25,300 -56.1% |
| 2007 | $1,104 -57.6% | $57,600 -58.6% |
| 2006 | $2,604 +445.6% | $139,200 +618.3% |
| 2004 | $477 +74.9% | $19,380 +97.8% |
| 2003 | $273 +88.9% | $9,800 +137.3% |
| 2002 | $144 | $4,130 -13.1% |
| 2000 | -- | $4,750 |
Find assessor info on the county website
Monthly payment
Estimated monthly payment
All calculations are estimates and provided by Zillow, Inc. for informational purposes only. Actual amounts may vary.
HOA fees may include property taxes on listings classified as Co-Ops. Contact the listing agent and/or owner for fee details.
Mortgage interest rates are dependent on a number of factors, including credit score, down payment, and repayment length. Interest rate data provided by Zillow Group Marketplace, Inc. as of 1/1/1970 from various mortgage lenders with which we have lead or other similar arrangements; the Estimated Payment is an average of those rates.
See how much you could borrow to make a competitive offer.
Climate risks
Neighborhood: 33993
Nearby schools
GreatSchools rating
- 2/10Hector A. Cafferata Jr Elementary SchoolGrades: PK-5Distance: 7.2 mi
- 3/10Mariner Middle SchoolGrades: 6-8Distance: 5.7 mi
- 3/10Mariner High SchoolGrades: 9-12Distance: 5.5 mi
Local experts in 33993


- Florida
- Lee County
- Cape Coral
- 33993
- 4003 Old Burnt Store Rd N
Nearby cities
Nearby neighborhoods
Nearby zip codes
Other Cape Coral Topics
