$340,000
3 bd|2 ba|1.1k sqft
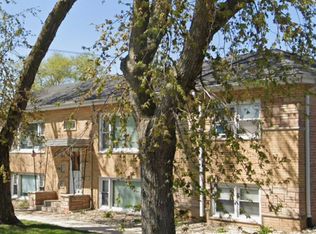
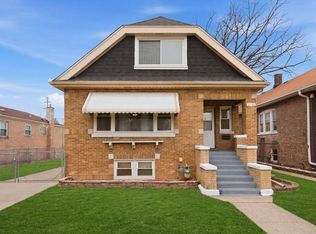
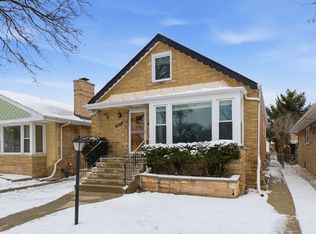
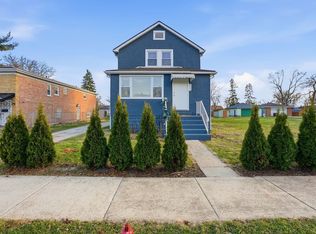
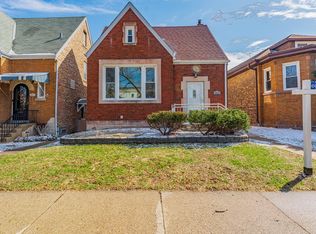
3904 Home Ave, Stickney, IL 60402
Sold
Likely to sell faster than
Zillow last checked: 7 hours ago
Listing updated: March 22, 2026 at 04:08pm
Dan Ortiz 630-439-5569,
Baird & Warner
Not available
Estimated sales range
Not available
Not available
| Date | Event | Price |
|---|---|---|
| 3/22/2026 | Contingent | $375,000$175/sqft |
Source: | ||
| 3/16/2026 | Listed for sale | $375,000-2.6%$175/sqft |
Source: | ||
| 3/6/2026 | Listing removed | $384,999$179/sqft |
Source: | ||
| 12/18/2025 | Listed for sale | $384,999$179/sqft |
Source: | ||
| 12/18/2025 | Listing removed | $384,999$179/sqft |
Source: | ||
| 11/18/2025 | Listed for sale | $384,999$179/sqft |
Source: | ||
| 11/18/2025 | Listing removed | $384,999$179/sqft |
Source: | ||
| 10/15/2025 | Contingent | $384,999$179/sqft |
Source: | ||
| 10/1/2025 | Listed for sale | $384,999$179/sqft |
Source: | ||
| 7/1/2025 | Contingent | $384,999$179/sqft |
Source: | ||
| 5/23/2025 | Price change | $384,999-1.3%$179/sqft |
Source: | ||
| 5/9/2025 | Listed for sale | $389,999$182/sqft |
Source: | ||
| 5/9/2025 | Listing removed | $389,999$182/sqft |
Source: | ||
| 3/13/2025 | Listed for sale | $389,999-4.9%$182/sqft |
Source: | ||
| 10/29/2024 | Listing removed | $410,000$191/sqft |
Source: | ||
| 8/3/2024 | Price change | $410,000-8.1%$191/sqft |
Source: | ||
| 7/27/2024 | Listed for sale | $446,000$208/sqft |
Source: | ||
| Year | Property taxes | Tax assessment |
|---|---|---|
| 2023 | $1,947 -68.6% | $28,000 +28.5% |
| 2022 | $6,207 +175.3% | $21,796 |
| 2021 | $2,254 +9.2% | $21,796 |
| 2020 | $2,064 -20.2% | $21,796 +14.2% |
| 2019 | $2,587 +2.3% | $19,081 |
| 2018 | $2,530 +4.7% | $19,081 |
| 2017 | $2,416 -34.7% | $19,081 +24.5% |
| 2016 | $3,697 -1.7% | $15,330 |
| 2015 | $3,760 -40.6% | $15,330 |
| 2014 | $6,330 +86.9% | $15,330 -19% |
| 2013 | $3,387 +8.3% | $18,932 |
| 2012 | $3,126 +2.6% | $18,932 |
| 2011 | $3,047 +28.1% | $18,932 -27.4% |
| 2010 | $2,379 +1.7% | $26,085 |
| 2009 | $2,339 +1.5% | $26,085 -10% |
| 2008 | $2,304 -9% | $28,984 +3.2% |
| 2007 | $2,533 -2.3% | $28,085 |
| 2006 | $2,593 +2.5% | $28,085 |
| 2005 | $2,530 -46.8% | $28,085 +45.1% |
| 2004 | $4,755 +53.2% | $19,354 |
| 2003 | $3,104 +17.9% | $19,354 |
| 2002 | $2,634 -17.9% | $19,354 +20.8% |
| 2001 | $3,209 +3.7% | $16,018 |
| 2000 | $3,094 -2.3% | $16,018 |
| 1999 | $3,165 | $16,018 |
Find assessor info on the county website
Source: MRED as distributed by MLS GRID. This data may not be complete. We recommend contacting the local school district to confirm school assignments for this home.