$9,526
-- bd|-- ba|-- sqft
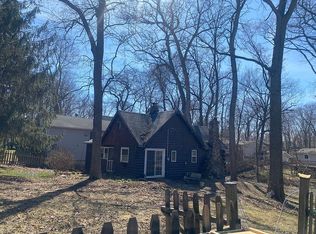
38554 N Lincoln Ave, Spring Grove, IL 60081
Off Market
Zillow last checked:
Listing updated:
Amber McEstes 847-306-6158,
Compass
Not available
Estimated sales range
Not available
Not available
| Date | Event | Price |
|---|---|---|
| 4/10/2026 | Contingent | $150,000$188/sqft |
Source: | ||
| 4/3/2026 | Listed for sale | $150,000+61.8%$188/sqft |
Source: | ||
| 5/28/2020 | Listing removed | $92,700$116/sqft |
Source: RE/MAX Plaza #10669534 Report a problem | ||
| 5/28/2020 | Listed for sale | $92,700+4.7%$116/sqft |
Source: RE/MAX Plaza #10669534 Report a problem | ||
| 5/27/2020 | Sold | $88,525-4.5%$111/sqft |
Source: | ||
| 4/21/2020 | Pending sale | $92,700$116/sqft |
Source: RE/MAX Plaza #10669534 Report a problem | ||
| 3/26/2020 | Price change | $92,700-4.9%$116/sqft |
Source: RE/MAX Plaza #10669534 Report a problem | ||
| 3/23/2020 | Listed for sale | $97,500$122/sqft |
Source: RE/MAX Plaza #10669534 Report a problem | ||
| 2/8/2019 | Listing removed | $895$1/sqft |
Source: Owner Report a problem | ||
| 9/28/2018 | Listed for rent | $895$1/sqft |
Source: Owner Report a problem | ||
| 3/23/2017 | Listing removed | $895$1/sqft |
Source: Zillow Rental Manager Report a problem | ||
| 2/20/2017 | Listed for rent | $895$1/sqft |
Source: Zillow Rental Manager Report a problem | ||
| 3/4/2016 | Listing removed | $895$1/sqft |
Source: Coldwell Banker Residential Brokerage - Libertyville #09136158 Report a problem | ||
| 2/12/2016 | Listed for rent | $895+12.6%$1/sqft |
Source: Coldwell Banker Residential Brokerage - Libertyville #09136158 Report a problem | ||
| 10/30/2012 | Listing removed | $795$1/sqft |
Source: Owner Report a problem | ||
| 8/31/2012 | Listed for rent | $795$1/sqft |
Source: Owner Report a problem | ||
| Year | Property taxes | Tax assessment |
|---|---|---|
| 2023 | $2,197 +13% | $30,645 +11.7% |
| 2022 | $1,945 +4.1% | $27,440 +16.9% |
| 2021 | $1,868 +1.6% | $23,468 +10.2% |
| 2020 | $1,840 +5.8% | $21,293 +4.6% |
| 2019 | $1,738 +5.2% | $20,362 +6.8% |
| 2018 | $1,653 | $19,057 +5.1% |
| 2017 | $1,653 -7.5% | $18,140 +3.6% |
| 2016 | $1,787 +43.3% | $17,506 +2.6% |
| 2015 | $1,247 +0.7% | $17,061 -6.2% |
| 2014 | $1,238 -1.8% | $18,195 -4% |
| 2012 | $1,260 +6.4% | $18,956 -10.1% |
| 2011 | $1,184 +3.8% | $21,096 -5.5% |
| 2010 | $1,141 +6.2% | $22,318 -3.9% |
| 2009 | $1,074 -3.8% | $23,213 -2% |
| 2008 | $1,116 +11.4% | $23,679 +5.1% |
| 2006 | $1,002 +10.9% | $22,535 |
| 2005 | $904 +5.5% | -- |
| 2004 | $857 -2.3% | -- |
| 2003 | $877 +4.1% | -- |
| 2002 | $843 +105.4% | -- |
| 2001 | $410 -48.4% | $15,297 +3.3% |
| 2000 | $795 | $14,810 |
Find assessor info on the county website
Source: MRED as distributed by MLS GRID. This data may not be complete. We recommend contacting the local school district to confirm school assignments for this home.
A local agent can set up tours, give advice and negotiate with sellers.