Great investor opportunity for a rental property. HOMEPATH FINANCING AVAILABLE for as little as 3c down and no appraisal fee. Call broker with questions.
Pre-foreclosure
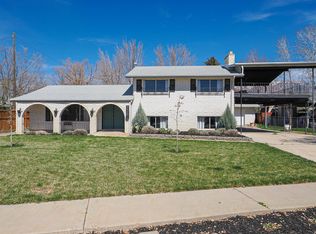
Street View
Est. $581,800
3675 N 500 E, Provo, UT 84604
5beds
3,600sqft
SingleFamily
Built in 1965
8,276 Square Feet Lot
$581,800 Zestimate®
$162/sqft
$-- HOA
Overview
- 47 days |
- 21 |
- 3 |
Facts & features
Interior
Bedrooms & bathrooms
- Bedrooms: 5
- Bathrooms: 3
- Full bathrooms: 3
Heating
- Forced air, Gas
Cooling
- Central
Appliances
- Included: Dishwasher, Dryer, Freezer, Garbage disposal, Microwave, Range / Oven, Refrigerator, Washer
Features
- Flooring: Tile, Carpet
- Basement: Finished
- Has fireplace: Yes
Interior area
- Total interior livable area: 3,600 sqft
Property
Parking
- Parking features: Garage - Attached
Features
- Exterior features: Stone, Wood products, Brick
- Has view: Yes
- View description: Mountain
Lot
- Size: 8,276 Square Feet
Details
- Parcel number: 360160009
Construction
Type & style
- Home type: SingleFamily
Materials
- masonry
- Roof: Built-up
Condition
- Year built: 1965
Community & HOA
Location
- Region: Provo
Financial & listing details
- Price per square foot: $162/sqft
- Tax assessed value: $538,300
- Annual tax amount: $3,008
Visit our professional directory to find a foreclosure specialist in your area that can help with your home search.
Find a foreclosure agentForeclosure details
Estimated market value
$581,800
$535,000 - $628,000
$2,912/mo
Price history
Price history
| Date | Event | Price |
|---|---|---|
| 3/3/2011 | Listing removed | $144,900$40/sqft |
Source: Fannie Mae #986726 Report a problem | ||
| 1/23/2011 | Pending sale | $144,900$40/sqft |
Source: Fannie Mae #986726 Report a problem | ||
| 12/4/2010 | Price change | $144,900-3.3%$40/sqft |
Source: Fannie Mae #986726 Report a problem | ||
| 10/25/2010 | Price change | $149,900-9.1%$42/sqft |
Source: foreclosure.com Report a problem | ||
| 10/2/2010 | Price change | $164,900-10.8%$46/sqft |
Source: foreclosure.com Report a problem | ||
| 8/22/2010 | Price change | $184,900-2.6%$51/sqft |
Source: foreclosure.com Report a problem | ||
| 7/29/2010 | Price change | $189,900-5%$53/sqft |
Source: Real Estate Results South #953406 Report a problem | ||
| 7/17/2010 | Price change | $199,900-4.8%$56/sqft |
Source: Real Estate Results South #953406 Report a problem | ||
| 6/5/2010 | Price change | $209,900-4.5%$58/sqft |
Source: foreclosure.com Report a problem | ||
| 5/13/2010 | Price change | $219,900-4.3%$61/sqft |
Source: foreclosure.com Report a problem | ||
| 4/2/2010 | Price change | $229,900-13.2%$64/sqft |
Source: foreclosure.com Report a problem | ||
| 3/27/2010 | Listed for sale | -- |
Source: foreclosure.com Report a problem | ||
| 2/9/2009 | Sold | -- |
Source: Public Record Report a problem | ||
| 9/18/2008 | Listing removed | $265,000$74/sqft |
Source: Prudential Real Estate #799426 Report a problem | ||
| 5/29/2008 | Listed for sale | $265,000$74/sqft |
Source: Prudential Real Estate #799426 Report a problem | ||
Public tax history
Public tax history
| Year | Property taxes | Tax assessment |
|---|---|---|
| 2024 | $3,008 +2.5% | $538,300 +4% |
| 2023 | $2,934 +2.6% | $517,700 +1.7% |
| 2022 | $2,861 +33.4% | $509,000 +152.9% |
| 2021 | $2,144 +4% | $201,245 -39% |
| 2020 | $2,062 +4% | $329,900 +81.8% |
| 2019 | $1,983 +17.7% | $181,445 -43.2% |
| 2018 | $1,684 +0.7% | $319,500 +104.6% |
| 2017 | $1,672 | $156,145 +8.1% |
| 2016 | $1,672 +13.4% | $144,485 +12.2% |
| 2015 | $1,475 +20.1% | $128,810 +15.2% |
| 2014 | $1,228 | $111,815 +5.8% |
| 2013 | -- | $105,710 -0.9% |
| 2012 | -- | $106,645 -13.7% |
| 2009 | -- | $123,530 -12.6% |
| 2008 | -- | $141,295 -3% |
| 2007 | -- | $145,640 +42.7% |
| 2006 | -- | $102,080 +5% |
| 2005 | -- | $97,229 |
| 2003 | -- | $97,229 -45% |
| 2001 | $1,014 +5.9% | $176,780 +94.5% |
| 2000 | $958 | $90,896 |
Find assessor info on the county website
Monthly payment
Estimated monthly payment
All calculations are estimates and provided by Zillow, Inc. for informational purposes only. Actual amounts may vary.
HOA fees may include property taxes on listings classified as Co-Ops. Contact the listing agent and/or owner for fee details.
Mortgage interest rates are dependent on a number of factors, including credit score, down payment, and repayment length. Interest rate data provided by Zillow Group Marketplace, Inc. as of 1/1/1970 from various mortgage lenders with which we have lead or other similar arrangements; the Estimated Payment is an average of those rates.
See how much you could borrow to make a competitive offer.
Climate risks
Neighborhood: North Timpview
Nearby schools
GreatSchools rating
- 7/10Edgemont SchoolGrades: K-6Distance: 0.2 mi
- 5/10Centennial Middle SchoolGrades: 7-8Distance: 1.2 mi
- 7/10Timpview High SchoolGrades: 9-12Distance: 0.3 mi
Schools provided by the listing agent
- Elementary: Edgement
- Middle: Centennial
- High: Timpview
- District: Provo
Source: The MLS. This data may not be complete. We recommend contacting the local school district to confirm school assignments for this home.

- Utah
- Utah County
- Provo
- 84604
- North Timpview
- 3675 N 500 E
Nearby cities
Nearby neighborhoods
Nearby zip codes
Other Provo Topics
