$305,000
3 bd|2 ba|1k sqft
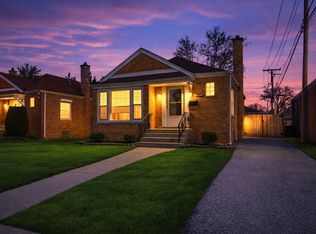
9200 S Saint Louis Ave, Evergreen Pk, IL 60805
New
MLS ID #12614692, Tiffany Chirillo, Berkshire Hathaway HomeServices Chicago. MRED as distributed by MLS GRID
Zillow last checked:
Listing updated:
Ravi Mehra 847-312-8250,
Platinum Partners Realtors
$271,300
$258,000 - $285,000
$3,151/mo
| Date | Event | Price |
|---|---|---|
| 4/28/2026 | Price change | $269,000-2.2%$207/sqft |
Source: | ||
| 4/22/2026 | Listed for sale | $275,000$212/sqft |
Source: | ||
| 4/4/2026 | Contingent | $275,000$212/sqft |
Source: | ||
| 4/1/2026 | Listed for sale | $275,000$212/sqft |
Source: | ||
| 3/23/2026 | Contingent | $275,000$212/sqft |
Source: | ||
| 3/18/2026 | Listed for sale | $275,000$212/sqft |
Source: | ||
| 2/25/2026 | Contingent | $275,000$212/sqft |
Source: | ||
| 2/19/2026 | Price change | $275,000-3.2%$212/sqft |
Source: | ||
| 2/9/2026 | Price change | $284,000-1.7%$218/sqft |
Source: | ||
| 1/30/2026 | Listed for sale | $289,000$222/sqft |
Source: | ||
| 1/29/2026 | Contingent | $289,000$222/sqft |
Source: | ||
| 1/7/2026 | Listed for sale | $289,000$222/sqft |
Source: | ||
| 11/11/2025 | Listing removed | $289,000$222/sqft |
Source: | ||
| 11/5/2025 | Contingent | $289,000$222/sqft |
Source: | ||
| 10/22/2025 | Price change | $289,000-3.3%$222/sqft |
Source: | ||
| 10/16/2025 | Listed for sale | $299,000$230/sqft |
Source: | ||
| 10/6/2025 | Listing removed | $299,000$230/sqft |
Source: | ||
| 9/25/2025 | Listed for sale | $299,000+11.2%$230/sqft |
Source: | ||
| 1/24/2025 | Listing removed | $269,000$207/sqft |
Source: | ||
| 1/20/2025 | Contingent | $269,000$207/sqft |
Source: | ||
| 1/2/2025 | Listed for sale | $269,000+85.5%$207/sqft |
Source: | ||
| 12/31/2024 | Sold | $145,000-47.1%$112/sqft |
Source: Public Record Report a problem | ||
| 12/4/2024 | Listed for sale | $274,000+95.7%$211/sqft |
Source: | ||
| 7/3/2017 | Sold | $140,000$108/sqft |
Source: | ||
| 5/24/2017 | Pending sale | $140,000+70.7%$108/sqft |
Source: Conlon: A Real Estate Company #09619017 Report a problem | ||
| 9/8/2010 | Sold | $82,000-56.8%$63/sqft |
Source: | ||
| 7/11/2006 | Sold | $190,000$146/sqft |
Source: Public Record Report a problem | ||
| Year | Property taxes | Tax assessment |
|---|---|---|
| 2023 | $2,271 +3.6% | $13,999 |
| 2022 | $2,193 +1.4% | $13,999 |
| 2021 | $2,162 -34.9% | $13,999 -5.2% |
| 2020 | $3,320 -0.2% | $14,774 -10% |
| 2019 | $3,326 +1.7% | $16,416 |
| 2018 | $3,271 +16.8% | $16,416 +27.4% |
| 2017 | $2,800 +7.5% | $12,890 |
| 2016 | $2,605 -0.3% | $12,890 -8.7% |
| 2015 | $2,612 -1.1% | $14,121 +0.1% |
| 2014 | $2,642 +30.6% | $14,101 +28.1% |
| 2013 | $2,023 +1.3% | $11,011 |
| 2012 | $1,996 -12.1% | $11,011 -20.8% |
| 2011 | $2,271 -0.5% | $13,896 |
| 2010 | $2,282 +4.3% | $13,896 |
| 2009 | $2,188 -10.8% | $13,896 -18% |
| 2008 | $2,452 +1% | $16,937 |
| 2007 | $2,428 -1% | $16,937 |
| 2006 | $2,453 +163.7% | $16,937 +41.5% |
| 2005 | $931 -5.1% | $11,966 |
| 2004 | $981 -8.3% | $11,966 |
| 2003 | $1,069 -11.6% | $11,966 +25.8% |
| 2002 | $1,210 +8.8% | $9,511 |
| 2001 | $1,112 -0.7% | $9,511 |
| 2000 | $1,119 +0% | $9,511 +7% |
| 1999 | $1,119 | $8,885 |
Find assessor info on the county website
Source: MRED as distributed by MLS GRID. This data may not be complete. We recommend contacting the local school district to confirm school assignments for this home.
A local agent can set up tours, give advice and negotiate with sellers.
A local lender can help you make sure your offer is ready when you are.