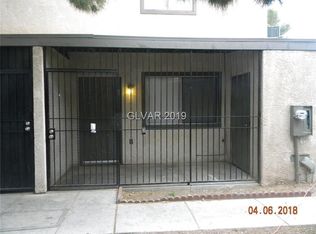
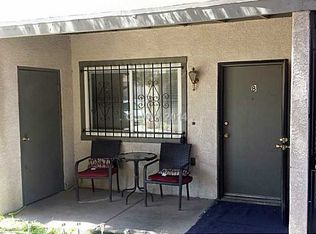
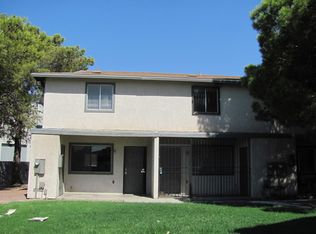
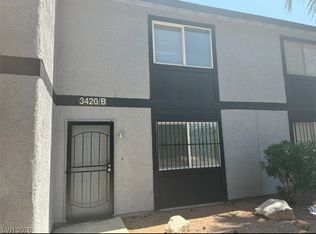
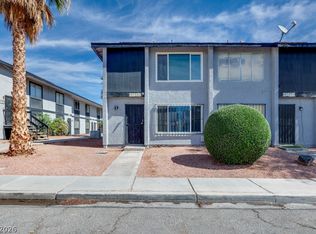
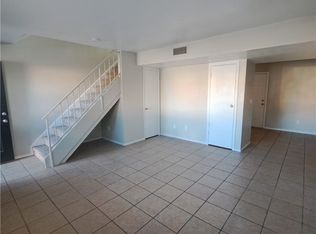
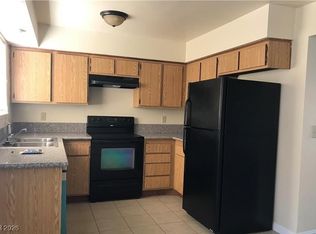
2 BEDROOM, 2 BATHROOM, TOWNHOME. FEATURES INCLUDE UPGRADED CARPETING, KITCHEN HAS BREAKFAST BAR, TILE FLOORING & ALL APPLIANCES. BEDROOMS ARE UPSTAIRS. UNIT HAS PLENTY OF STORAGE INSIDE & OUT. COVERED & SECURED, FRONT PATIO.
Pre-foreclosure
Est. $159,400
3533 Rio Robles Dr, North Las Vegas, NV 89030
2beds
896sqft
Townhouse
Built in 1982
435 Square Feet Lot
$159,400 Zestimate®
$178/sqft
$120/mo HOA
Overview
- 187 days |
- 21 |
- 3 |
Facts & features
Interior
Bedrooms & bathrooms
- Bedrooms: 2
- Bathrooms: 2
- Full bathrooms: 1
- 1/2 bathrooms: 1
Heating
- Forced air, Gas
Cooling
- Central
Appliances
- Included: Dishwasher, Dryer, Garbage disposal, Refrigerator, Washer
Features
- Flooring: Carpet
Interior area
- Total interior livable area: 896 sqft
Property
Features
- Exterior features: Stucco
Lot
- Size: 435 Square Feet
Details
- Parcel number: 13912710016
- Zoning: Single Family
Construction
Type & style
- Home type: Townhouse
Materials
- Frame
- Roof: Composition
Condition
- Year built: 1982
Utilities & green energy
- Sewer: Public
Community & HOA
HOA
- Has HOA: Yes
- HOA fee: $120 monthly
Location
- Region: North Las Vegas
Financial & listing details
- Price per square foot: $178/sqft
- Tax assessed value: $75,906
- Annual tax amount: $1,099
Visit our professional directory to find a foreclosure specialist in your area that can help with your home search.
Find a foreclosure agentForeclosure details
Estimated market value
$159,400
$145,000 - $172,000
$1,262/mo
Price history
Price history
| Date | Event | Price |
|---|---|---|
| 10/3/2018 | Sold | $92,900+3.3%$104/sqft |
Source: Public Record Report a problem | ||
| 7/10/2018 | Listed for sale | $89,900+150.4%$100/sqft |
Source: Rezults Realty #2011063 Report a problem | ||
| 10/27/2017 | Listing removed | $600$1/sqft |
Source: Rezults Realty #1938827 Report a problem | ||
| 10/13/2017 | Listed for rent | $600+4.3%$1/sqft |
Source: Rezults Realty #1938827 Report a problem | ||
| 3/4/2015 | Listing removed | $575$1/sqft |
Source: Rezults Realty #1517820 Report a problem | ||
| 2/24/2015 | Listed for rent | $575$1/sqft |
Source: Rezults Realty #1517820 Report a problem | ||
| 12/13/2014 | Listing removed | $35,900$40/sqft |
Source: Rezults Realty #1491365 Report a problem | ||
| 10/28/2014 | Listed for sale | $35,900+59.6%$40/sqft |
Source: Rezults Realty #1491365 Report a problem | ||
| 10/8/2014 | Listing removed | $575$1/sqft |
Source: Rezults Realty #1484170 Report a problem | ||
| 10/1/2014 | Listed for rent | $575$1/sqft |
Source: Rezults Realty #1484170 Report a problem | ||
| 9/26/2014 | Listing removed | $22,500$25/sqft |
Source: WYNN Realty Group #1270377 Report a problem | ||
| 8/30/2012 | Listed for sale | $22,500$25/sqft |
Source: WYNN Realty Group #1270377 Report a problem | ||
Public tax history
Public tax history
| Year | Property taxes | Tax assessment |
|---|---|---|
| 2025 | $1,099 +224.3% | $26,567 +7.8% |
| 2024 | $339 +7.9% | $24,653 +8.2% |
| 2023 | $314 +7.9% | $22,781 +13.8% |
| 2022 | $291 +7.9% | $20,019 -0.3% |
| 2021 | $270 +6.9% | $20,071 +13.4% |
| 2020 | $252 +4.8% | $17,696 +4.5% |
| 2019 | $241 +5.6% | $16,930 |
| 2018 | $228 | $16,930 +8% |
| 2017 | $228 | $15,669 +33.6% |
| 2016 | $228 +4.2% | $11,727 +39.5% |
| 2015 | $219 | $8,407 +0.1% |
| 2014 | $219 | $8,399 |
| 2013 | -- | $8,399 +35.7% |
| 2012 | -- | $6,191 -7.6% |
| 2011 | -- | $6,698 +17% |
| 2010 | -- | $5,723 -66.3% |
| 2009 | -- | $16,966 |
| 2008 | -- | $16,966 +2.3% |
| 2007 | -- | $16,592 +21.8% |
| 2006 | -- | $13,624 +20.8% |
| 2005 | -- | $11,281 +20% |
| 2004 | -- | $9,401 +0.4% |
| 2003 | -- | $9,366 -8.2% |
| 2002 | -- | $10,200 -14.1% |
| 2001 | -- | $11,870 |
Find assessor info on the county website
Monthly payment
Estimated monthly payment
All calculations are estimates and provided by Zillow, Inc. for informational purposes only. Actual amounts may vary.
HOA fees may include property taxes on listings classified as Co-Ops. Contact the listing agent and/or owner for fee details.
Mortgage interest rates are dependent on a number of factors, including credit score, down payment, and repayment length. Interest rate data provided by Zillow Group Marketplace, Inc. as of 1/1/1970 from various mortgage lenders with which we have lead or other similar arrangements; the Estimated Payment is an average of those rates.
See how much you could borrow to make a competitive offer.
Climate risks
Neighborhood: 89030
Nearby schools
GreatSchools rating
- 4/10Lois Craig Elementary SchoolGrades: PK-5Distance: 0.6 mi
- 3/10Marvin M Sedway Middle SchoolGrades: 6-8Distance: 2.6 mi
- 3/10Canyon Springs High School And The Leadership AndGrades: 9-12Distance: 1.9 mi
Schools provided by the listing agent
- Elementary: Cox Clyde*
- Middle: Sedway Marvin M
- High: Canyon Springs HS
Source: The MLS. This data may not be complete. We recommend contacting the local school district to confirm school assignments for this home.
- Nevada
- Clark County
- North Las Vegas
- 89030
- 3533 Rio Robles Dr
Nearby cities
Nearby neighborhoods
Nearby zip codes
Other North Las Vegas Topics
