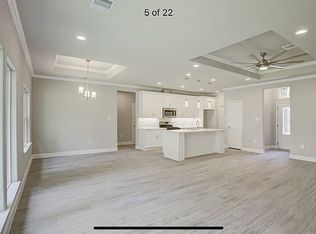
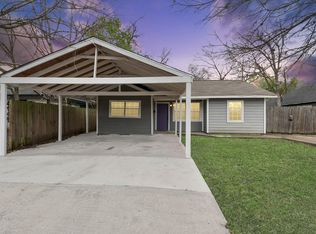
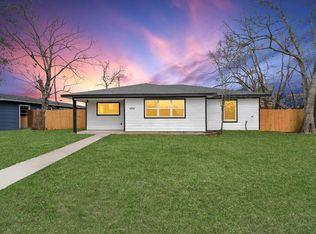
Welcome to this beautiful and well-located single-family home in the OST - South Union neighborhood, offering convenient access to major highways like 288 and 610, making commutes to Downtown, the Medical Center, and the University of Houston quick and easy. The area is served by Houston ISD, with Whidby Elementary, Cullen Middle, and Yates High School nearby. The neighborhood continues to grow with new commercial developments, parks, and dining options, enhancing its appeal. This property is a great opportunity for homeowners or investors looking for a well-connected and developing area in Houston.
For sale
Price cut: $5K (2/26)
$210,000
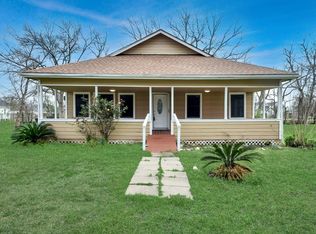
3437 Seabrook St, Houston, TX 77021
3beds
1,298sqft
Est.:
Single Family Residence
Built in 1945
5,000.69 Square Feet Lot
$197,300 Zestimate®
$162/sqft
$-- HOA
What's special
- 64 days |
- 401 |
- 27 |
Zillow last checked: 7 hours ago
Listing updated: February 26, 2026 at 10:10am
Listed by:
Wenhao Ye TREC #0799706 347-774-5396,
Walzel Properties - Corporate Office
Source: HAR,MLS#: 94542973
Tour with a local agent
Facts & features
Interior
Bedrooms & bathrooms
- Bedrooms: 3
- Bathrooms: 2
- Full bathrooms: 2
Heating
- Electric
Cooling
- Electric
Interior area
- Total structure area: 1,298
- Total interior livable area: 1,298 sqft
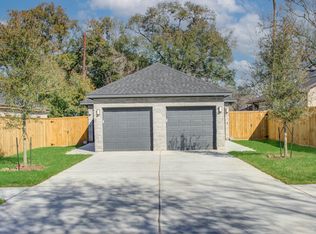
Property
Features
- Stories: 1
Lot
- Size: 5,000.69 Square Feet
- Features: Other, 0 Up To 1/4 Acre
Details
- Parcel number: 0741520860026
Construction
Type & style
- Home type: SingleFamily
- Architectural style: Traditional
- Property subtype: Single Family Residence
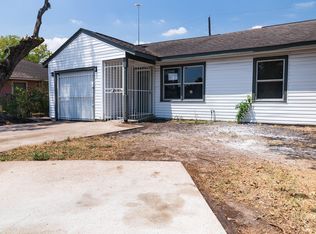
Materials
- Cement Siding
- Foundation: Block & Beam
- Roof: Composition
Condition
- New construction: No
- Year built: 1945
Utilities & green energy
- Sewer: Public Sewer
- Water: Public
Community & HOA
Community
- Subdivision: South Union Sec 01
Location
- Region: Houston
Financial & listing details
- Price per square foot: $162/sqft
- Tax assessed value: $166,813
- Annual tax amount: $3,545
- Date on market: 2/4/2026
Estimated market value
$197,300
$187,000 - $207,000
$1,828/mo
Price history
Price history
| Date | Event | Price |
|---|---|---|
| 4/1/2026 | Listing removed | $1,650$1/sqft |
Source: | ||
| 3/18/2026 | Listed for rent | $1,650$1/sqft |
Source: | ||
| 3/17/2026 | Listing removed | $1,650$1/sqft |
Source: | ||
| 2/26/2026 | Listed for rent | $1,650$1/sqft |
Source: | ||
| 2/26/2026 | Price change | $210,000-2.3%$162/sqft |
Source: | ||
| 2/25/2026 | Listing removed | $1,650$1/sqft |
Source: | ||
| 2/20/2026 | Price change | $1,650-2.9%$1/sqft |
Source: | ||
| 2/6/2026 | Listed for rent | $1,700$1/sqft |
Source: | ||
| 2/6/2026 | Listing removed | $1,700$1/sqft |
Source: | ||
| 1/20/2026 | Price change | $215,000+2.4%$166/sqft |
Source: | ||
| 1/20/2026 | Listed for rent | $1,700+6.3%$1/sqft |
Source: | ||
| 8/2/2025 | Listing removed | $1,600$1/sqft |
Source: | ||
| 7/25/2025 | Price change | $1,600-3%$1/sqft |
Source: | ||
| 7/15/2025 | Listed for rent | $1,650-2.9%$1/sqft |
Source: | ||
| 7/15/2025 | Listing removed | $1,700$1/sqft |
Source: | ||
| 7/10/2025 | Price change | $210,000-0.9%$162/sqft |
Source: | ||
| 7/1/2025 | Price change | $212,000-1.4%$163/sqft |
Source: | ||
| 5/29/2025 | Listed for rent | $1,700$1/sqft |
Source: | ||
| 5/28/2025 | Listing removed | $1,700$1/sqft |
Source: | ||
| 5/12/2025 | Listed for rent | $1,700$1/sqft |
Source: | ||
| 5/12/2025 | Listed for sale | $215,000$166/sqft |
Source: | ||
| 5/12/2025 | Listing removed | $1,700$1/sqft |
Source: | ||
| 5/9/2025 | Pending sale | $215,000$166/sqft |
Source: | ||
| 4/5/2025 | Listed for sale | $215,000$166/sqft |
Source: | ||
| 3/13/2025 | Listed for rent | $1,700$1/sqft |
Source: | ||
Public tax history
Public tax history
| Year | Property taxes | Tax assessment |
|---|---|---|
| 2025 | $3,545 -9.9% | $166,813 -11.3% |
| 2024 | $3,934 -4.5% | $188,000 -17.8% |
| 2023 | $4,117 -1.6% | $228,792 +12.8% |
| 2022 | $4,184 | $202,825 +31.8% |
| 2021 | -- | $153,928 +118.4% |
| 2020 | $1,626 +4.3% | $70,488 +9.5% |
| 2019 | $1,559 +24.9% | $64,396 +30.3% |
| 2018 | $1,249 | $49,424 |
| 2017 | $1,249 +4.2% | $49,424 +8.4% |
| 2016 | $1,199 +2.3% | $45,595 |
| 2015 | $1,172 | $45,595 |
| 2014 | $1,172 | $45,595 |
| 2013 | -- | $45,595 |
| 2012 | -- | $45,595 |
| 2011 | -- | $45,595 |
| 2010 | -- | $45,595 |
| 2009 | -- | $45,595 |
| 2008 | -- | $45,595 |
| 2007 | -- | $45,595 +9.5% |
| 2006 | -- | $41,658 +44.5% |
| 2005 | -- | $28,820 +10% |
| 2004 | -- | $26,200 |
| 2003 | -- | $26,200 +11.5% |
| 2002 | -- | $23,500 |
| 2001 | -- | $23,500 +2.6% |
| 2000 | -- | $22,900 |
Find assessor info on the county website
Monthly payment
Est. payment
$1,353/mo
Principal & interest
$1047
Property taxes
$306
More affordability tools
Climate risks
Neighborhood: Ost - South Union
Nearby schools
GreatSchools rating
- 4/10Whidby Elementary SchoolGrades: PK-5Distance: 0.4 mi
- 4/10Cullen Middle SchoolGrades: 6-8Distance: 0.7 mi
- 5/10Yates High SchoolGrades: 9-12Distance: 2.8 mi
Schools provided by the listing agent
- Elementary: Whidby Elementary School
- Middle: Cullen Middle School (Houston)
- High: Yates High School
Source: HAR. This data may not be complete. We recommend contacting the local school district to confirm school assignments for this home.
Local experts in 77021
- Texas
- Harris County
- Houston
- 77021
- Ost - South Union
- 3437 Seabrook St
Nearby cities
Nearby neighborhoods
Nearby zip codes
Other Houston Topics
