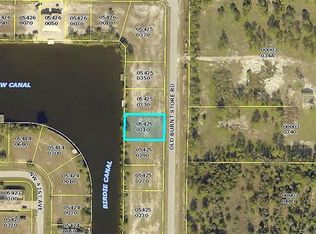
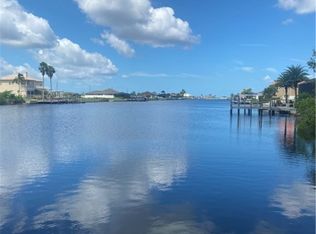
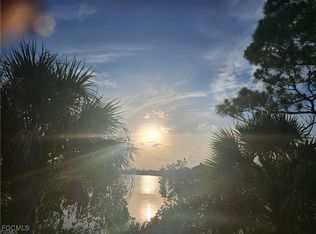
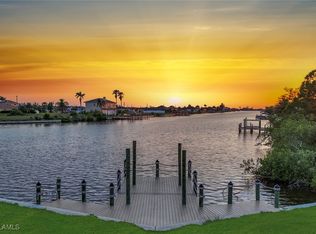
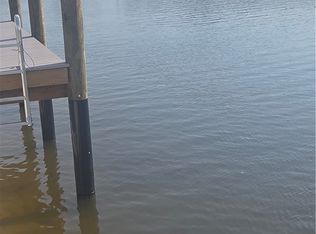
Wow!!!! What a view! Western exposure. Build your dream home on this fantastic gulf access, no bridges, lot. Beautiful large estate homes in the area. Close access to Burnt Store Rd which is being widen to 4 lanes giving quick access to Cape Coral, Punta Gorda and US 75 but far enough away from the hustle and bustle to really enjoy the Florida lifestyle.
Pre-foreclosure
Est. $161,549
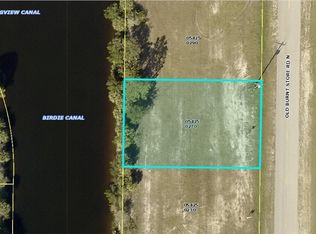
3312 Old Burnt Store Rd N, Cape Coral, FL 33993
--beds
0baths
10,001Square Feet
VacantLand
Built in ----
10,001 Square Feet Lot
$-- Zestimate®
$--/sqft
$-- HOA
Overview
- 271 days |
- 10 |
- 1 |
Visit our professional directory to find a foreclosure specialist in your area that can help with your home search.
Find a foreclosure agentForeclosure details
Estimated market value
Not available
Estimated sales range
Not available
$1,921/mo
Price history
Price history
| Date | Event | Price |
|---|---|---|
| 4/27/2022 | Sold | $275,000+37.5% |
Source: Public Record Report a problem | ||
| 4/6/2016 | Listing removed | $200,000 |
Source: RE/MAX Realty Team #216010880 Report a problem | ||
| 2/9/2016 | Listed for sale | $200,000+25.1% |
Source: RE/MAX Realty Team #216010880 Report a problem | ||
| 5/19/2004 | Sold | $159,900 |
Source: Public Record Report a problem | ||
Public tax history
Public tax history
| Year | Property taxes | Tax assessment |
|---|---|---|
| 2025 | $3,064 -19.7% | $161,549 -24.7% |
| 2024 | $3,816 -0.1% | $214,530 +0.5% |
| 2023 | $3,819 +101.4% | $213,489 +151.6% |
| 2022 | $1,896 +1.7% | $84,855 |
| 2021 | $1,864 +9.7% | -- |
| 2020 | $1,699 +14.2% | $70,128 +1.8% |
| 2019 | $1,488 | $68,863 +3.1% |
| 2018 | $1,488 +4% | $66,783 -22.6% |
| 2017 | $1,431 -4.5% | $86,296 +35.4% |
| 2016 | $1,498 +16.6% | $63,724 -9.5% |
| 2015 | $1,285 -0.1% | $70,445 +9.2% |
| 2014 | $1,286 +9.4% | $64,515 +79.3% |
| 2013 | $1,176 +13.3% | $35,986 -19% |
| 2012 | $1,037 -17.1% | $44,406 -19.9% |
| 2011 | $1,252 +20.3% | $55,406 +29.2% |
| 2010 | $1,040 -33.7% | $42,900 -38.1% |
| 2009 | $1,568 -14% | $69,300 -32.3% |
| 2008 | $1,822 -50.6% | $102,300 -51.1% |
| 2007 | $3,692 -51.2% | $209,000 -50% |
| 2006 | $7,571 +187.4% | $418,000 +239.3% |
| 2004 | $2,634 +56.4% | $123,200 +65.4% |
| 2003 | $1,684 +156.3% | $74,480 +171.4% |
| 2002 | $657 | $27,440 +100% |
| 2000 | -- | $13,720 |
Find assessor info on the county website
Monthly payment
Estimated monthly payment
All calculations are estimates and provided by Zillow, Inc. for informational purposes only. Actual amounts may vary.
HOA fees may include property taxes on listings classified as Co-Ops. Contact the listing agent and/or owner for fee details.
Mortgage interest rates are dependent on a number of factors, including credit score, down payment, and repayment length. Interest rate data provided by Zillow Group Marketplace, Inc. as of 1/1/1970 from various mortgage lenders with which we have lead or other similar arrangements; the Estimated Payment is an average of those rates.
See how much you could borrow to make a competitive offer.
Climate risks
Neighborhood: 33993
Nearby schools
GreatSchools rating
- 2/10Hector A. Cafferata Jr Elementary SchoolGrades: PK-5Distance: 6.4 mi
- 3/10Mariner Middle SchoolGrades: 6-8Distance: 4.8 mi
- 3/10Mariner High SchoolGrades: 9-12Distance: 4.7 mi


- Florida
- Lee County
- Cape Coral
- 33993
- 3312 Old Burnt Store Rd N
Nearby cities
Nearby neighborhoods
Nearby zip codes
Other Cape Coral Topics
