$292,400
-- bd|-- ba|3k sqft
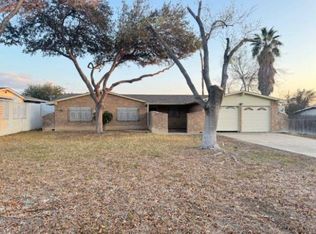
321 Farrell Rd, Laredo, TX 78045
Off Market
Likely to sell faster than
Zillow last checked: 8 hours ago
Listing updated: February 18, 2026 at 04:03pm
Cesar Martinez 956-237-5235,
Top-Site Realty LLC
$311,900
$296,000 - $327,000
$1,588/mo
| Date | Event | Price |
|---|---|---|
| 2/19/2026 | Price change | $315,000-3.1%$153/sqft |
Source: | ||
| 1/6/2026 | Price change | $325,000-3%$157/sqft |
Source: | ||
| 10/7/2025 | Listed for sale | $335,000+15.9%$162/sqft |
Source: | ||
| 6/6/2025 | Sold | -- |
Source: | ||
| 4/25/2025 | Price change | $289,000-3.3%$140/sqft |
Source: | ||
| 3/14/2025 | Listed for sale | $299,000-5.1%$145/sqft |
Source: | ||
| 3/10/2025 | Listing removed | $315,000$153/sqft |
Source: | ||
| 12/16/2024 | Price change | $315,000-4.4%$153/sqft |
Source: | ||
| 11/15/2024 | Listed for sale | $329,500+112.6%$160/sqft |
Source: | ||
| 4/14/2017 | Sold | -- |
Source: | ||
| 11/29/2016 | Listing removed | $155,000$75/sqft |
Source: Tere Santos Real Estate LLC #20162123 Report a problem | ||
| 10/27/2016 | Listed for sale | $155,000-18.4%$75/sqft |
Source: Tere Santos Real Estate LLC #20162123 Report a problem | ||
| 1/30/2016 | Listing removed | $190,000$92/sqft |
Source: EXIT Realty Laredo #20152280 Report a problem | ||
| 12/21/2015 | Listed for sale | $190,000+2.7%$92/sqft |
Source: EXIT Realty Laredo #20152280 Report a problem | ||
| 7/12/2014 | Listing removed | $185,000$90/sqft |
Source: EXIT Realty Laredo #20140020 Report a problem | ||
| 1/22/2014 | Listed for sale | $185,000$90/sqft |
Source: EXIT Realty Laredo #20140020 Report a problem | ||
| Year | Property taxes | Tax assessment |
|---|---|---|
| 2025 | -- | $231,213 +0.9% |
| 2024 | $1,438 +1.9% | $229,212 +6% |
| 2023 | $1,411 +5.9% | $216,207 +10% |
| 2022 | $1,332 +2.2% | $196,552 +10% |
| 2021 | $1,303 +8.8% | $178,684 +10% |
| 2020 | $1,198 -99% | $162,440 -2.2% |
| 2019 | $123,035 | $166,120 -2.1% |
| 2018 | -- | $169,730 +5.3% |
| 2017 | $1,214 -45.4% | $161,140 +9.4% |
| 2016 | $2,221 -0.4% | $147,290 +4.5% |
| 2015 | $2,231 | $140,930 +1.3% |
| 2014 | $2,231 | $139,150 +2.7% |
| 2013 | -- | $135,430 +6.8% |
| 2012 | -- | $126,760 -2.1% |
| 2011 | -- | $129,520 |
| 2010 | -- | $129,520 -1.3% |
| 2009 | -- | $131,260 -1.9% |
| 2008 | -- | $133,870 +6.1% |
| 2007 | -- | $126,130 +10% |
| 2006 | -- | $114,664 +10% |
| 2005 | -- | $104,240 +4.2% |
| 2004 | -- | $100,050 +6.7% |
| 2003 | -- | $93,790 |
| 2002 | -- | $93,790 +6.2% |
| 2001 | -- | $88,310 +2.7% |
| 2000 | -- | $86,000 |
Find assessor info on the county website
Source: LAR. This data may not be complete. We recommend contacting the local school district to confirm school assignments for this home.