$171,500
2 bd|2 ba|1.2k sqft
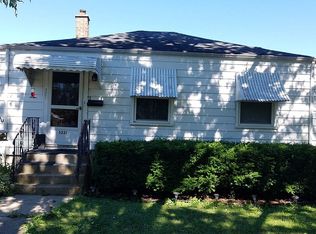
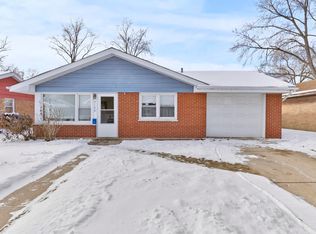
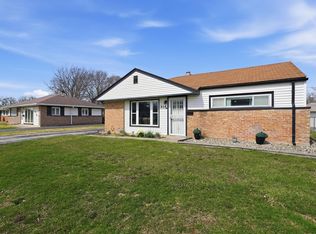
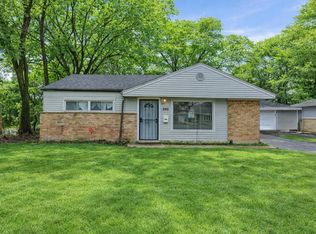
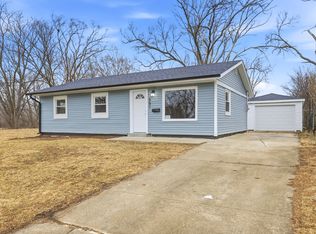
3233 Sangamon St, Steger, IL 60475
Off Market
Zillow last checked: 7 hours ago
Listing updated: March 27, 2026 at 11:24am
Cindy Trotier, CSC 815-549-1262,
Keller Williams Preferred Rlty
Not available
Estimated sales range
Not available
Not available
| Date | Event | Price |
|---|---|---|
| 3/27/2026 | Contingent | $165,000$233/sqft |
Source: | ||
| 3/20/2026 | Listed for sale | $165,000+200%$233/sqft |
Source: | ||
| 6/29/2018 | Sold | $55,000$78/sqft |
Source: | ||
| 5/9/2018 | Pending sale | $55,000$78/sqft |
Source: RE/MAX 2000 #09937739 Report a problem | ||
| 5/3/2018 | Listed for sale | $55,000+10.2%$78/sqft |
Source: RE/MAX 2000 #09937739 Report a problem | ||
| 10/7/2014 | Listing removed | $49,900$70/sqft |
Source: RE/MAX 2000 #08683257 Report a problem | ||
| 7/9/2014 | Price change | $49,900-9.1%$70/sqft |
Source: RE/MAX 2000 #08519524 Report a problem | ||
| 6/17/2014 | Price change | $54,900-5.2%$77/sqft |
Source: RE/MAX 2000 #08519524 Report a problem | ||
| 1/19/2014 | Listed for sale | $57,900-27.5%$82/sqft |
Source: RE/MAX 2000 #08519524 Report a problem | ||
| 1/27/2013 | Listing removed | $79,900$113/sqft |
Source: McColly Real Estate #08000754 Report a problem | ||
| 8/18/2012 | Price change | $79,900-6%$113/sqft |
Source: McColly Real Estate #08000754 Report a problem | ||
| 2/22/2012 | Listed for sale | $85,000+37.1%$120/sqft |
Source: McColly Real Estate #08000754 Report a problem | ||
| 4/23/2001 | Sold | $62,000$87/sqft |
Source: Public Record Report a problem | ||
| Year | Property taxes | Tax assessment |
|---|---|---|
| 2023 | $590 -45% | $7,392 +21.8% |
| 2022 | $1,072 +3.6% | $6,067 |
| 2021 | $1,035 -5.8% | $6,067 |
| 2020 | $1,099 -21.6% | $6,067 -17% |
| 2019 | $1,402 +3.6% | $7,311 |
| 2018 | $1,353 -2.8% | $7,311 |
| 2017 | $1,391 -14.4% | $7,311 +3.9% |
| 2016 | $1,625 +3.3% | $7,037 |
| 2015 | $1,573 -1% | $7,037 |
| 2014 | $1,589 -10.3% | $7,037 -12.9% |
| 2013 | $1,771 -0.4% | $8,081 |
| 2012 | $1,778 -1.5% | $8,081 |
| 2011 | $1,805 -9.4% | $8,081 -24.7% |
| 2010 | $1,993 +10.7% | $10,727 |
| 2009 | $1,800 +9.5% | $10,727 -5% |
| 2008 | $1,644 +2.8% | $11,292 +16.8% |
| 2007 | $1,599 +6.3% | $9,666 |
| 2006 | $1,505 +9.5% | $9,666 |
| 2005 | $1,374 -5.7% | $9,666 +19.5% |
| 2004 | $1,458 -0.2% | $8,089 |
| 2003 | $1,461 -7.1% | $8,089 |
| 2002 | $1,573 +13.4% | $8,089 +4.3% |
| 2001 | $1,388 +234% | $7,753 |
| 2000 | $416 | $7,753 |
| 1999 | $416 | $7,753 |
Find assessor info on the county website
Source: MRED as distributed by MLS GRID. This data may not be complete. We recommend contacting the local school district to confirm school assignments for this home.