$100,900
3 bd|1 ba|1k sqft
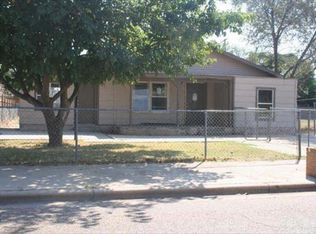
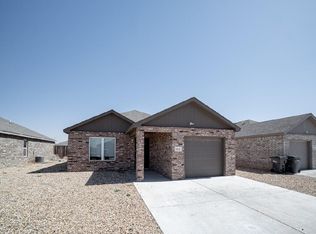
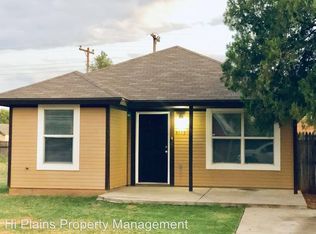
3113 Duke St, Lubbock, TX 79415
Off Market
Zillow last checked: 7 hours ago
Listing updated: March 14, 2026 at 07:57am
Steven Bishop TREC #0702245 806-543-6502,
Brick & Loft Realty
$210,700
$200,000 - $221,000
$1,346/mo
| Date | Event | Price |
|---|---|---|
| 3/14/2026 | Listed for sale | $215,000+8.9%$147/sqft |
Source: | ||
| 2/5/2026 | Listed for rent | $1,695$1/sqft |
Source: Zillow Rentals Report a problem | ||
| 10/21/2025 | Listing removed | $1,695$1/sqft |
Source: Zillow Rentals Report a problem | ||
| 10/1/2025 | Listed for rent | $1,695+5.9%$1/sqft |
Source: Zillow Rentals Report a problem | ||
| 6/19/2024 | Listing removed | -- |
Source: Zillow Rentals Report a problem | ||
| 6/17/2024 | Price change | $1,600-8.6%$1/sqft |
Source: Zillow Rentals Report a problem | ||
| 6/9/2024 | Listed for rent | $1,750$1/sqft |
Source: Zillow Rentals Report a problem | ||
| 6/8/2024 | Listing removed | -- |
Source: Zillow Rentals Report a problem | ||
| 4/29/2024 | Price change | $1,750-2.8%$1/sqft |
Source: Zillow Rentals Report a problem | ||
| 4/11/2024 | Listed for rent | $1,800+5.9%$1/sqft |
Source: Zillow Rentals Report a problem | ||
| 2/15/2024 | Listing removed | -- |
Source: Zillow Rentals Report a problem | ||
| 1/16/2024 | Listed for rent | $1,700$1/sqft |
Source: Zillow Rentals Report a problem | ||
| 6/7/2023 | Sold | -- |
Source: | ||
| 5/9/2023 | Pending sale | $197,400$135/sqft |
Source: | ||
| 3/14/2023 | Price change | $197,400-1.3%$135/sqft |
Source: | ||
| 1/23/2023 | Price change | $199,900-3.4%$137/sqft |
Source: | ||
| 11/18/2022 | Price change | $206,900-2.4%$142/sqft |
Source: | ||
| 10/20/2022 | Listed for sale | $211,900$145/sqft |
Source: | ||
| Year | Property taxes | Tax assessment |
|---|---|---|
| 2025 | $4,051 -0.8% | $228,938 +1.8% |
| 2024 | $4,084 -6.2% | $224,890 -4% |
| 2023 | $4,355 +25715.1% | $234,287 +28025.7% |
| 2022 | $17 -4.8% | $833 |
| 2021 | $18 -0.7% | $833 |
| 2020 | $18 -1.5% | $833 |
| 2019 | $18 -3.2% | $833 |
| 2018 | $19 | $833 |
| 2017 | $19 +1.1% | $833 |
| 2016 | $19 | $833 |
| 2015 | $19 | $833 |
| 2014 | $19 | $833 |
| 2013 | -- | $833 |
| 2012 | -- | $833 |
| 2011 | -- | $833 |
| 2010 | -- | $833 |
| 2009 | -- | $833 |
| 2008 | -- | $833 |
| 2007 | -- | $833 |
| 2006 | -- | $833 |
| 2005 | -- | $833 |
| 2004 | -- | $833 |
| 2003 | -- | $833 |
| 2002 | $21 +0.1% | $833 |
| 2001 | $21 +0.7% | $833 |
| 2000 | $20 | $833 |
Find assessor info on the county website
Source: LBMLS. This data may not be complete. We recommend contacting the local school district to confirm school assignments for this home.