$339,400
-- bd|1 ba|1.2k sqft
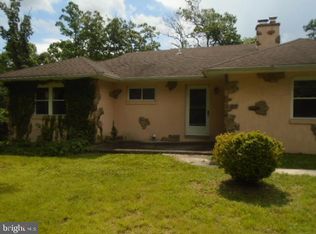
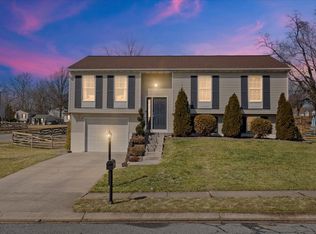
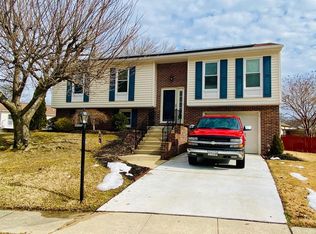
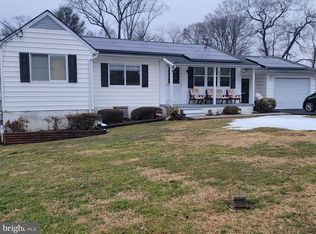
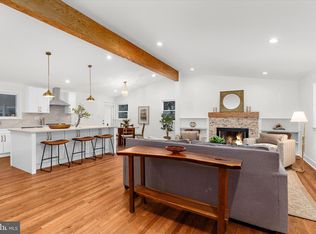
3140 Abingdon Rd, Abingdon, MD 21009
Off Market
Zillow last checked: 9 hours ago
Listing updated: March 03, 2026 at 10:05am
Wilmer Vasquez-Martinez 571-225-1803,
Spring Hill Real Estate, LLC. 7038914520
$676,000
$642,000 - $710,000
$2,548/mo
| Date | Event | Price |
|---|---|---|
| 3/3/2026 | Listed for sale | $690,000+79.2%$391/sqft |
Source: | ||
| 12/19/2024 | Sold | $385,000+2.7%$218/sqft |
Source: | ||
| 10/3/2024 | Pending sale | $374,900$213/sqft |
Source: | ||
| 10/2/2024 | Listing removed | $374,900$213/sqft |
Source: | ||
| 9/23/2024 | Price change | $374,900-6%$213/sqft |
Source: | ||
| 9/18/2024 | Listed for sale | $399,000+17.4%$226/sqft |
Source: | ||
| 12/31/2020 | Sold | $340,000+0%$193/sqft |
Source: | ||
| 11/26/2020 | Pending sale | $339,999$193/sqft |
Source: Long & Foster Real Estate, Inc. #MDHR253972 Report a problem | ||
| 11/15/2020 | Listed for sale | $339,999+84.8%$193/sqft |
Source: Long & Foster Real Estate, Inc. #MDHR253972 Report a problem | ||
| 9/18/2015 | Sold | $184,000-7.9%$104/sqft |
Source: Agent Provided Report a problem | ||
| 8/5/2015 | Price change | $199,789-9.1%$113/sqft |
Source: RE/MAX COMPONENTS #HR8588547 Report a problem | ||
| 3/31/2015 | Listed for sale | $219,900-2.3%$125/sqft |
Source: RE/MAX COMPONENTS #HR8588547 Report a problem | ||
| 2/26/2015 | Listing removed | $225,000$128/sqft |
Source: ExecuHome Realty #HR8439469 Report a problem | ||
| 10/26/2014 | Price change | $225,000-6.2%$128/sqft |
Source: ExecuHome Realty #HR8439469 Report a problem | ||
| 8/25/2014 | Listed for sale | $239,900$136/sqft |
Source: ExecuHome Realty #HR8439469 Report a problem | ||
| Year | Property taxes | Tax assessment |
|---|---|---|
| 2025 | $3,162 +16.6% | $284,600 +14.3% |
| 2024 | $2,713 +16.7% | $248,900 +16.7% |
| 2023 | $2,324 | $213,200 |
| 2022 | $2,324 -4.3% | $213,200 |
| 2021 | $2,428 -1.7% | $213,200 -0.4% |
| 2020 | $2,471 +1.4% | $214,100 |
| 2019 | $2,437 +1.4% | $214,100 +2.8% |
| 2018 | $2,404 +1.4% | $208,300 +1.4% |
| 2017 | $2,370 | $205,400 +1.2% |
| 2016 | -- | $203,000 +1.2% |
| 2015 | -- | $200,600 +1.2% |
| 2014 | $2,268 | $198,200 |
| 2013 | -- | $198,200 |
| 2012 | -- | $198,200 -5% |
| 2011 | -- | $208,600 +3.3% |
| 2010 | -- | $201,862 +3.5% |
| 2009 | -- | $195,076 +3.6% |
| 2008 | -- | $188,290 +13.2% |
| 2007 | -- | $166,380 +15.2% |
| 2006 | -- | $144,470 +17.9% |
| 2005 | -- | $122,560 +4% |
| 2004 | -- | $117,806 +4.2% |
| 2003 | -- | $113,053 +4.4% |
| 2002 | -- | $108,300 +1.8% |
| 2001 | -- | $106,366 |
Find assessor info on the county website
Source: Bright MLS. This data may not be complete. We recommend contacting the local school district to confirm school assignments for this home.