$391,900
5.6 Acres
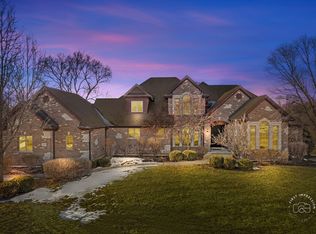
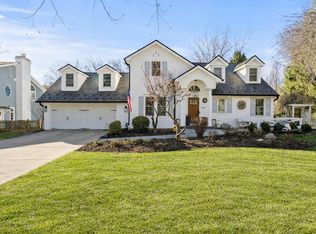
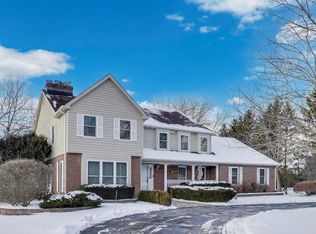
114 Algonquin Rd, Barrington, IL 60010
Off Market
Zillow last checked: 8 hours ago
Listing updated: January 21, 2026 at 10:07pm
Fel Salgado (224)699-5002,
Redfin Corporation
Not available
Estimated sales range
Not available
Not available
| Date | Event | Price |
|---|---|---|
| 1/16/2026 | Listed for sale | $1,239,000$228/sqft |
Source: | ||
| 1/7/2026 | Contingent | $1,239,000$228/sqft |
Source: | ||
| 10/24/2025 | Listed for sale | $1,239,000-0.8%$228/sqft |
Source: | ||
| 10/22/2025 | Listing removed | $1,249,000$229/sqft |
Source: | ||
| 9/22/2025 | Contingent | $1,249,000$229/sqft |
Source: | ||
| 9/16/2025 | Listed for sale | $1,249,000$229/sqft |
Source: | ||
| 9/4/2025 | Contingent | $1,249,000$229/sqft |
Source: | ||
| 8/25/2025 | Listed for sale | $1,249,000-3.8%$229/sqft |
Source: | ||
| 8/25/2025 | Listing removed | $1,299,000$239/sqft |
Source: | ||
| 6/5/2025 | Listed for sale | $1,299,000-6.5%$239/sqft |
Source: | ||
| 6/5/2025 | Listing removed | $1,390,000$255/sqft |
Source: | ||
| 4/24/2025 | Listed for sale | $1,390,000+54.6%$255/sqft |
Source: | ||
| 9/30/2019 | Listing removed | $899,000$165/sqft |
Source: @properties #10360148 Report a problem | ||
| 4/29/2019 | Listed for sale | $899,000+24%$165/sqft |
Source: @properties #10360148 Report a problem | ||
| 1/29/2016 | Sold | $725,000-4.6%$133/sqft |
Source: | ||
| 1/14/2016 | Pending sale | $759,900$140/sqft |
Source: RE/MAX Advantage Realty #09078235 Report a problem | ||
| 1/14/2016 | Price change | $759,900-3.8%$140/sqft |
Source: RE/MAX Advantage Realty #09078235 Report a problem | ||
| 11/3/2015 | Listed for sale | $789,900-29.8%$145/sqft |
Source: RE/MAX Advantage Realty #09078235 Report a problem | ||
| 6/13/2006 | Sold | $1,125,000+136.8%$207/sqft |
Source: Public Record Report a problem | ||
| 2/26/1998 | Sold | $475,000$87/sqft |
Source: Public Record Report a problem | ||
| Year | Property taxes | Tax assessment |
|---|---|---|
| 2023 | $20,117 +2.4% | $83,999 |
| 2022 | $19,640 -1.9% | $83,999 +12.3% |
| 2021 | $20,016 +3% | $74,766 |
| 2020 | $19,427 +2.8% | $74,766 -10% |
| 2019 | $18,893 -32.2% | $83,074 -30.7% |
| 2018 | $27,854 +2.2% | $119,896 |
| 2017 | $27,242 +5.7% | $119,896 |
| 2016 | $25,782 +4.6% | $119,896 +17.2% |
| 2015 | $24,656 +2.8% | $102,343 |
| 2014 | $23,991 +4.2% | $102,343 |
| 2013 | $23,030 -2.3% | $102,343 -7% |
| 2012 | $23,567 +6.1% | $110,007 |
| 2011 | $22,202 +2.1% | $110,007 |
| 2010 | $21,736 +1.7% | $110,007 -7.4% |
| 2009 | $21,366 +11.3% | $118,804 -4% |
| 2008 | $19,192 -6.2% | $123,755 |
| 2007 | $20,460 +5.7% | $123,755 +10% |
| 2006 | $19,358 -3.9% | $112,500 -8.6% |
| 2005 | $20,152 +3.8% | $123,042 |
| 2004 | $19,410 -8.4% | $123,042 +8.7% |
| 2003 | $21,182 +14.3% | $113,229 |
| 2002 | $18,540 +31.7% | $113,229 |
| 2001 | $14,077 +6.1% | $113,229 +19.6% |
| 2000 | $13,269 +8.5% | $94,647 |
| 1999 | $12,224 | $94,647 |
Find assessor info on the county website
Source: MRED as distributed by MLS GRID. This data may not be complete. We recommend contacting the local school district to confirm school assignments for this home.