- Calendar Days 0-7: No offers will be considered for the first 7 calendar days a home is listed. We want REO's to have exposure to the market and potential buyers. - Calendar Days 8-12: We will consider offers on the property ONLY from NSP buyers, municipalities, non-profit organizations and owner-occupants. - Calendar Days 13+: We will consider offers from all buyers. PROPERTY SOLD 'AS-IS'.
Pre-foreclosure
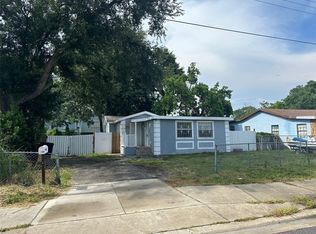
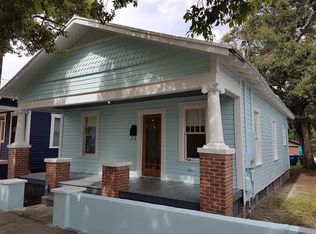
Street View
Est. $303,200
3023 W Green St, Tampa, FL 33607
4beds
1baths
1,188sqft
SingleFamily
Built in 1946
5,662 Square Feet Lot
$303,200 Zestimate®
$255/sqft
$-- HOA
Overview
- 85 days |
- 164 |
- 4 |
Facts & features
Interior
Bedrooms & bathrooms
- Bedrooms: 4
- Bathrooms: 1
Heating
- Other
Cooling
- Central
Features
- Flooring: Other, Concrete, Hardwood, Linoleum / Vinyl
Interior area
- Total interior livable area: 1,188 sqft
Property
Features
- Exterior features: Stucco
Lot
- Size: 5,662 Square Feet
Details
- Parcel number: 1829154PX000002000140A
Construction
Type & style
- Home type: SingleFamily
Materials
- masonry
- Roof: Composition
Condition
- Year built: 1946
Community & HOA
Location
- Region: Tampa
Financial & listing details
- Price per square foot: $255/sqft
- Tax assessed value: $235,535
- Annual tax amount: $2,069
Visit our professional directory to find a foreclosure specialist in your area that can help with your home search.
Find a foreclosure agentForeclosure details
Estimated market value
$303,200
$273,000 - $330,000
$2,484/mo
Price history
Price history
| Date | Event | Price |
|---|---|---|
| 7/23/2025 | Listing removed | $226,000$190/sqft |
Source: | ||
| 5/12/2025 | Price change | $226,000-9.6%$190/sqft |
Source: | ||
| 11/19/2024 | Pending sale | $250,000$210/sqft |
Source: | ||
| 10/31/2024 | Listed for sale | $250,000-6%$210/sqft |
Source: | ||
| 12/18/2023 | Listing removed | -- |
Source: | ||
| 11/8/2023 | Price change | $265,999-2.9%$224/sqft |
Source: | ||
| 10/25/2023 | Listed for sale | $273,999-0.4%$231/sqft |
Source: | ||
| 8/24/2023 | Listing removed | -- |
Source: | ||
| 8/15/2023 | Pending sale | $275,000$231/sqft |
Source: | ||
| 8/11/2023 | Price change | $275,000-6.8%$231/sqft |
Source: | ||
| 7/25/2023 | Price change | $295,000-3.2%$248/sqft |
Source: | ||
| 7/18/2023 | Price change | $304,900-3.2%$257/sqft |
Source: | ||
| 7/10/2023 | Listed for sale | $314,900+96.8%$265/sqft |
Source: | ||
| 3/18/2019 | Sold | $160,000+540%$135/sqft |
Source: Agent Provided Report a problem | ||
| 2/2/2011 | Sold | $25,000-16.4%$21/sqft |
Source: Stellar MLS #U7494114 Report a problem | ||
| 12/19/2010 | Price change | $29,900-73.3%$25/sqft |
Source: RE/MAX REALTEC GROUP INC. #7494114 Report a problem | ||
| 12/4/2010 | Listed for sale | -- |
Source: foreclosure.com Report a problem | ||
| 9/20/2006 | Sold | $112,000+75%$94/sqft |
Source: Public Record Report a problem | ||
| 8/5/2000 | Sold | $64,000+326.7%$54/sqft |
Source: Public Record Report a problem | ||
| 11/18/1993 | Sold | $15,000$13/sqft |
Source: Public Record Report a problem | ||
Public tax history
Public tax history
| Year | Property taxes | Tax assessment |
|---|---|---|
| 2024 | $2,069 +3.3% | $146,066 +3% |
| 2023 | $2,002 +3.5% | $141,812 +3% |
| 2022 | $1,935 +1.8% | $137,682 +3% |
| 2021 | $1,900 +1.4% | $133,672 +1.4% |
| 2020 | $1,874 -6.7% | $131,826 +53.1% |
| 2019 | $2,008 | $86,113 +5.4% |
| 2018 | $2,008 +48.9% | $81,730 +24% |
| 2017 | $1,349 +13.5% | $65,910 +50.7% |
| 2016 | $1,188 +14.9% | $43,738 +10% |
| 2015 | $1,034 +25.7% | $39,762 +10% |
| 2014 | $823 | $36,147 +10% |
| 2013 | $823 +23.6% | $32,861 +10% |
| 2012 | $666 -16.8% | $29,874 -17.1% |
| 2011 | $800 +66.9% | $36,049 -22.2% |
| 2010 | $479 -45.8% | $46,327 -42.8% |
| 2009 | $884 -39.8% | $81,052 -24.8% |
| 2008 | $1,470 -45.5% | $107,810 -13.6% |
| 2007 | $2,696 +305.2% | $124,842 +138% |
| 2006 | $665 +2.7% | $52,457 +3% |
| 2005 | $648 | $50,929 +3% |
| 2004 | -- | $49,446 +1.9% |
| 2003 | -- | $48,524 +2.4% |
| 2002 | -- | $47,387 +1.6% |
| 2001 | -- | $46,641 +14.2% |
| 2000 | $1,041 | $40,824 |
Find assessor info on the county website
Monthly payment
Estimated monthly payment
All calculations are estimates and provided by Zillow, Inc. for informational purposes only. Actual amounts may vary.
HOA fees may include property taxes on listings classified as Co-Ops. Contact the listing agent and/or owner for fee details.
Mortgage interest rates are dependent on a number of factors, including credit score, down payment, and repayment length. Interest rate data provided by Zillow Group Marketplace, Inc. as of 1/1/1970 from various mortgage lenders with which we have lead or other similar arrangements; the Estimated Payment is an average of those rates.
See how much you could borrow to make a competitive offer.
Climate risks
Neighborhood: Northeast Macfarlane
Nearby schools
GreatSchools rating
- 7/10West Tampa Elementary SchoolGrades: PK-5Distance: 0.4 mi
- 5/10Madison Middle SchoolGrades: 6-8Distance: 3.9 mi
- 3/10Jefferson High SchoolGrades: 9-12Distance: 1.7 mi

- Florida
- Hillsborough County
- Tampa
- 33607
- Northeast Macfarlane
- 3023 W Green St
Nearby cities
Nearby neighborhoods
Nearby zip codes
Other Tampa Topics
