This home is a Real Estate Owned (REO)/Post Foreclosure. Once a lender has foreclosed on a property it is soon put up for public auction. If bids fall short of the asking price the bank will buy back the home and attempt to sell it on the open market. However, lenders are not real estate agents, meaning that they will often accept offers significantly below market value!
Pre-foreclosure
Est. $260,000
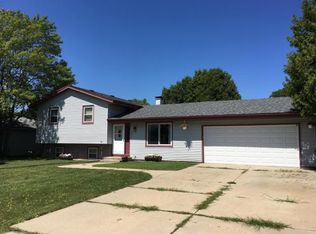
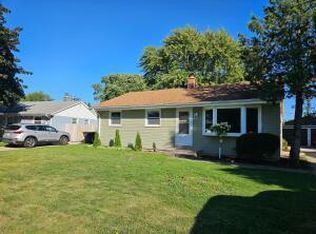
2935 Blue Jay Ct, Racine, WI 53402
3beds
1baths
--sqft
SingleFamily
Built in 1978
8,712 Square Feet Lot
$260,000 Zestimate®
$--/sqft
$-- HOA
Overview
- 40 days |
- 6 |
- 0 |
Facts & features
Interior
Bedrooms & bathrooms
- Bedrooms: 3
- Bathrooms: 1
Property
Lot
- Size: 8,712 Square Feet
Details
- Parcel number: 104042317356000
Construction
Type & style
- Home type: SingleFamily
Condition
- Year built: 1978
Community & HOA
Location
- Region: Racine
Financial & listing details
- Tax assessed value: $213,600
- Annual tax amount: $3,239
Visit our professional directory to find a foreclosure specialist in your area that can help with your home search.
Find a foreclosure agentForeclosure details
Estimated market value
$260,000
$231,000 - $283,000
$1,894/mo
Price history
Price history
| Date | Event | Price |
|---|---|---|
| 4/26/2010 | Listing removed | $100,000 |
Source: foreclosure.com Report a problem | ||
| 3/7/2010 | Price change | $100,000 |
Source: foreclosure.com Report a problem | ||
| 2/22/2010 | Listed for sale | -- |
Source: foreclosure.com Report a problem | ||
Public tax history
Public tax history
| Year | Property taxes | Tax assessment |
|---|---|---|
| 2024 | $3,239 -34.4% | $213,600 +0.2% |
| 2023 | $4,934 +50.3% | $213,200 +0.6% |
| 2022 | $3,283 +17.9% | $211,900 +28.3% |
| 2021 | $2,785 | $165,100 +13.4% |
| 2020 | -- | $145,600 |
| 2019 | $3,628 +69.4% | $145,600 +26.5% |
| 2018 | $2,141 -0.7% | $115,100 |
| 2017 | $2,156 -6.3% | $115,100 -4.4% |
| 2016 | $2,301 | $120,400 |
| 2015 | $2,301 +4.1% | $120,400 |
| 2014 | $2,210 -10.6% | $120,400 |
| 2013 | $2,471 -4.3% | $120,400 |
| 2012 | $2,582 -4.5% | $120,400 -19.7% |
| 2011 | $2,702 +3.2% | $149,900 |
| 2010 | $2,620 -16.8% | $149,900 |
| 2009 | $3,149 +0.8% | $149,900 |
| 2008 | $3,123 +1.8% | $149,900 |
| 2007 | $3,069 +1.1% | $149,900 |
| 2006 | $3,035 +4.3% | $149,900 +33.6% |
| 2005 | $2,909 +19.2% | $112,200 |
| 2004 | $2,439 -6.3% | $112,200 |
| 2003 | $2,602 +16.7% | $112,200 |
| 2002 | $2,229 -8.6% | $112,200 +19% |
| 2001 | $2,438 +9.4% | $94,300 |
| 2000 | $2,228 | $94,300 |
Find assessor info on the county website
BuyAbility℠ payment
Estimated monthly payment
Boost your down payment with 6% savings match
Earn up to a 6% match & get a competitive APY with a *. Zillow has partnered with to help get you home faster.
Learn more*Terms apply. Match provided by Foyer. Account offered by Pacific West Bank, Member FDIC.Climate risks
Neighborhood: 53402
Nearby schools
GreatSchools rating
- 6/10O Brown Elementary SchoolGrades: PK-5Distance: 0.7 mi
- 1/10Jerstad-Agerholm Elementary SchoolGrades: PK-8Distance: 3.3 mi
- 3/10Horlick High SchoolGrades: 9-12Distance: 4.3 mi