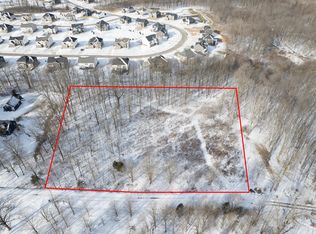
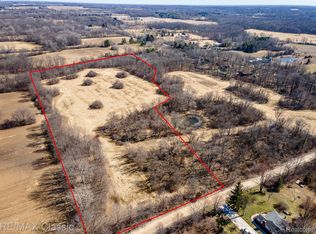
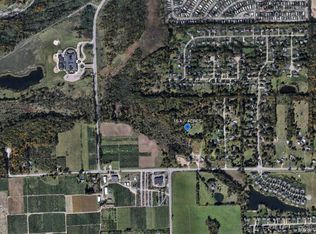
Prime opportunity in Lyon Township! This 5-acre cleared lot offers the perfect canvas! The property is ready for a single family estate or the ability to be subdivided (see attached docs). Public utilities are conveniently located on the same side of the street as the property, allowing for easy access. Nestled in a desirable area with award-winning schools, this property combines space, privacy, and flexibility. Enjoy the benefit of Lyon Twp taxes while being just minutes from shopping, dining, and major expressways. Don’t miss out on this rare chance to own acreage in a sought-after location with endless possibilities!
Lot/land
$369,000
25100 Martindale Rd, South Lyon, MI 48178
--beds
1baths
5Acres
Land
Built in ----
5 Acres Lot
$191,500 Zestimate®
$--/sqft
$-- HOA
What's special
- 300 days |
- 272 |
- 13 |
Zillow last checked: 7 hours ago
Listing updated: February 11, 2026 at 01:53am
Listed by:
Daniel T Novak 248-560-7545,
Remerica United Realty-Brighton 810-202-1850,
Drake Temple 810-202-1850,
Remerica United Realty-Brighton
Source: Realcomp II,MLS#: 20250035432
Facts & features
Interior
Bedrooms & bathrooms
- Bathrooms: 1
Features
- Has basement: No
- Has fireplace: No
Property
Lot
- Size: 5 Acres
- Dimensions: 162 x 1318 x 164 x 1319
- Features: Cleared
Details
- Parcel number: 2120226002
- Zoning description: Residential
- Special conditions: Short Sale No,Standard
Utilities & green energy
- Sewer: Sewer At Street
- Water: Well
Community & HOA
HOA
- Has HOA: No
Location
- Region: South Lyon
Financial & listing details
- Tax assessed value: $103,880
- Annual tax amount: $5,118
- Date on market: 5/21/2025
- Cumulative days on market: 301 days
- Listing agreement: Exclusive Right To Sell
- Listing terms: Cash,Conventional
Estimated market value
$191,500
$161,000 - $222,000
$1,992/mo
Price history
Price history
| Date | Event | Price |
|---|---|---|
| 11/12/2025 | Price change | $369,000-2.6% |
Source: | ||
| 9/9/2025 | Price change | $379,000-8.7% |
Source: | ||
| 5/21/2025 | Listed for sale | $415,000+186.2% |
Source: | ||
| 11/28/2022 | Sold | $145,000-3.3% |
Source: | ||
| 11/22/2022 | Pending sale | $150,000 |
Source: | ||
| 11/21/2022 | Price change | $150,000-18.9% |
Source: | ||
| 11/16/2022 | Price change | $185,000-7.5% |
Source: | ||
| 10/23/2022 | Listed for sale | $199,900-13.1% |
Source: | ||
| 10/15/2022 | Contingent | $230,000 |
Source: | ||
| 9/26/2022 | Price change | $230,000-4.2% |
Source: | ||
| 9/16/2022 | Price change | $240,000-4% |
Source: | ||
| 9/7/2022 | Price change | $250,000-3.5% |
Source: | ||
| 8/30/2022 | Listed for sale | $259,000-0.3% |
Source: | ||
| 6/11/2008 | Listing removed | $259,900 |
Source: Homes.com #28074357 Report a problem | ||
| 5/8/2008 | Listed for sale | $259,900 |
Source: Homes.com #28074357 Report a problem | ||
Public tax history
Public tax history
| Year | Property taxes | Tax assessment |
|---|---|---|
| 2024 | $4,925 +140.1% | $111,100 +12.3% |
| 2023 | $2,051 +10.1% | $98,940 +6.6% |
| 2022 | $1,862 0% | $92,850 +5.3% |
| 2021 | $1,863 | $88,140 +7.4% |
| 2020 | -- | $82,040 +4% |
| 2019 | $1,859 -1.6% | $78,890 +1.4% |
| 2018 | $1,888 +0.1% | $77,770 +4.5% |
| 2017 | $1,887 | $74,410 +3.4% |
| 2016 | $1,887 | $71,960 +8.8% |
| 2015 | -- | $66,130 +10.8% |
| 2014 | -- | $59,710 +9.6% |
| 2011 | -- | $54,470 -10% |
| 2010 | $1,847 +6.9% | $60,540 -21.9% |
| 2009 | $1,727 +58.3% | $77,480 -42.3% |
| 2005 | $1,091 | $134,260 +69.4% |
| 2003 | -- | $79,250 +5.1% |
| 2002 | -- | $75,410 +57.8% |
| 2001 | $1,370 +6.6% | $47,790 +3.2% |
| 2000 | $1,286 | $46,310 |
Find assessor info on the county website
BuyAbility℠ payment
Estimated monthly payment
All calculations are estimates and provided by Zillow, Inc. for informational purposes only. Actual amounts may vary.
HOA fees may include property taxes on listings classified as Co-Ops. Contact the listing agent and/or owner for fee details.
Mortgage interest rates are dependent on a number of factors, including credit score, down payment, and repayment length. Interest rate data provided by Zillow Group Marketplace, Inc. as of 1/1/1970 from various mortgage lenders with which we have lead or other similar arrangements; the Estimated Payment is an average of those rates.
See how much you could borrow to make a competitive offer.
Boost your down payment with 6% savings match
Earn up to a 6% match & get a competitive APY with a *. Zillow has partnered with to help get you home faster.
Learn more*Terms apply. Match provided by Foyer. Account offered by Pacific West Bank, Member FDIC.Climate risks
Neighborhood: 48178
Nearby schools
GreatSchools rating
- 8/10William A Pearson ElementaryGrades: K-5Distance: 0.9 mi
- 7/10Centennial Middle SchoolGrades: 6-8Distance: 2.2 mi
- 8/10South Lyon High SchoolGrades: 9-12Distance: 0.7 mi
Local experts in 48178


- Michigan
- Oakland County
- South Lyon
- 48178
- 25100 Martindale Rd
Nearby cities
Nearby zip codes
Other South Lyon Topics
