$507,800
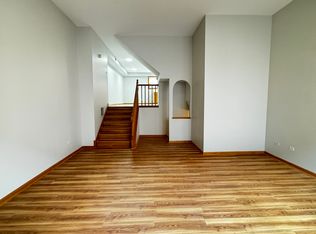
3 bd|3 ba|2.2k sqft
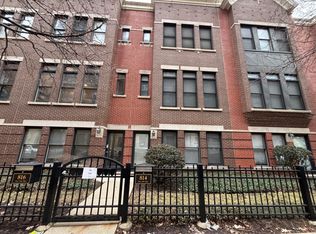
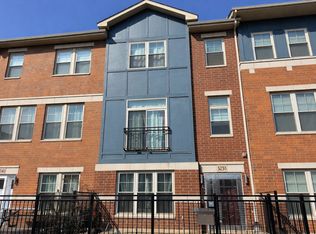
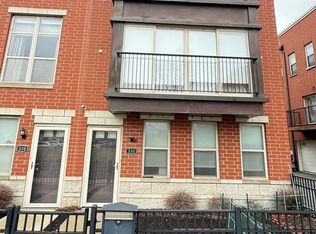
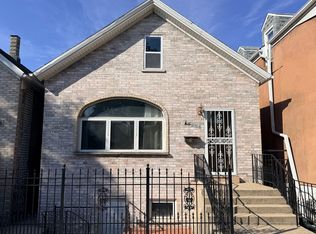
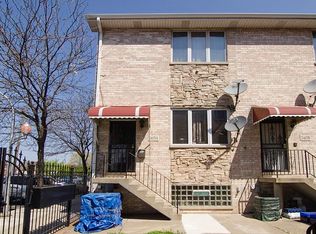
2415 S Normal Ave UNIT A, Chicago, IL 60616
Off Market
Zillow last checked: 7 hours ago
Listing updated: February 10, 2026 at 02:50pm
James Lau 312-326-1886,
Goodland Realty Inc.
Not available
Estimated sales range
Not available
Not available
| Date | Event | Price |
|---|---|---|
| 1/30/2026 | Listed for sale | $529,000+205.8%$230/sqft |
Source: | ||
| 7/31/2025 | Listing removed | $2,400$1/sqft |
Source: Zillow Rentals Report a problem | ||
| 7/18/2025 | Listed for rent | $2,400+14.3%$1/sqft |
Source: Zillow Rentals Report a problem | ||
| 5/10/2019 | Listing removed | $2,100$1/sqft |
Source: CENTURY 21 Realty Associates #10303953 Report a problem | ||
| 4/17/2019 | Price change | $2,100-4.5%$1/sqft |
Source: CENTURY 21 Realty Associates #10303953 Report a problem | ||
| 3/14/2019 | Listed for rent | $2,200+175.7%$1/sqft |
Source: CENTURY 21 Realty Associates #10303953 Report a problem | ||
| 10/6/2017 | Listing removed | $798 |
Source: Owner Report a problem | ||
| 10/5/2017 | Listed for rent | $798+14% |
Source: Owner Report a problem | ||
| 6/6/2017 | Listing removed | $700 |
Source: Zillow Rental Network Report a problem | ||
| 5/25/2017 | Price change | $700-53.3% |
Source: Zillow Rental Network Report a problem | ||
| 5/22/2017 | Listed for rent | $1,500$1/sqft |
Source: Zillow Rental Network Report a problem | ||
| 1/8/1996 | Sold | $173,000$75/sqft |
Source: Public Record Report a problem | ||
| Year | Property taxes | Tax assessment |
|---|---|---|
| 2023 | $7,107 +2.9% | $36,999 |
| 2022 | $6,907 +2% | $36,999 |
| 2021 | $6,770 -2.9% | $36,999 +7.5% |
| 2020 | $6,973 -1.5% | $34,406 -11% |
| 2019 | $7,078 +1.7% | $38,659 |
| 2018 | $6,958 +2.6% | $38,659 +10.8% |
| 2017 | $6,782 +4.6% | $34,878 |
| 2016 | $6,486 +9.7% | $34,878 |
| 2015 | $5,911 +17.1% | $34,878 +17.2% |
| 2014 | $5,046 +2.2% | $29,765 |
| 2013 | $4,935 -0.4% | $29,765 -1.2% |
| 2012 | $4,956 +7.4% | $30,115 -9.1% |
| 2011 | $4,616 +18.4% | $33,131 -1.8% |
| 2010 | $3,900 +14% | $33,727 |
| 2009 | $3,420 +2.8% | $33,727 +2.1% |
| 2008 | $3,327 +3.2% | $33,042 |
| 2007 | $3,224 +0.8% | $33,042 |
| 2006 | $3,199 -1.2% | $33,042 +52.6% |
| 2005 | $3,238 +1.6% | $21,647 |
| 2004 | $3,187 +1.6% | $21,647 |
| 2003 | $3,136 -6.4% | $21,647 +5.8% |
| 2002 | $3,350 +4.9% | $20,467 |
| 2001 | $3,194 -6.2% | $20,467 |
| 2000 | $3,406 -0.3% | $20,467 +3.8% |
| 1999 | $3,416 | $19,727 |
Find assessor info on the county website
Source: MRED as distributed by MLS GRID. This data may not be complete. We recommend contacting the local school district to confirm school assignments for this home.