$85,000
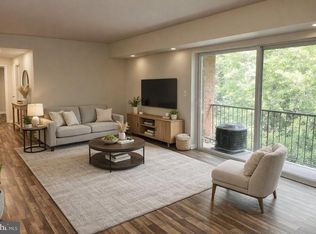
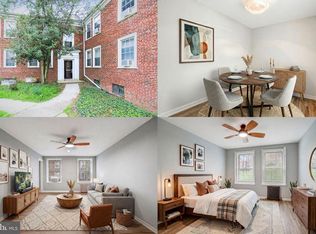
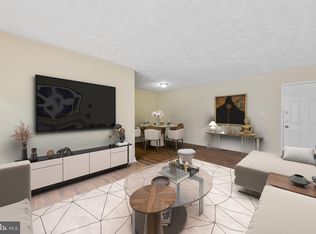
2 bd|1 ba|816 sqft
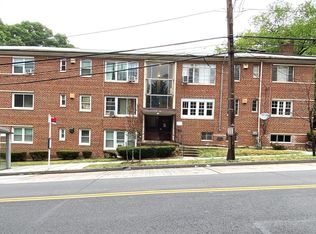
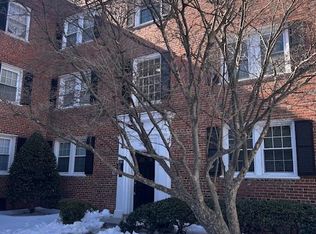
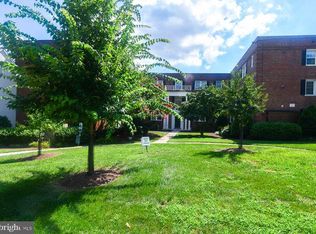
2400 Good Hope Rd SE APT 103, Washington, DC 20020
Sold
Zillow last checked: 7 hours ago
Listing updated: January 19, 2026 at 06:44am
Monique Lucas 240-764-5092,
BML Properties Realty, LLC.
Not available
Estimated sales range
Not available
Not available
| Date | Event | Price |
|---|---|---|
| 1/16/2026 | Listed for sale | $115,000+15%$141/sqft |
Source: | ||
| 9/1/2025 | Listing removed | $100,000$123/sqft |
Source: | ||
| 6/12/2024 | Listed for sale | $100,000+233.3%$123/sqft |
Source: | ||
| 2/2/2019 | Listing removed | $30,000$37/sqft |
Source: RE/MAX PROFESSIONALS #DCDC344222 Report a problem | ||
| 1/31/2019 | Listed for sale | $30,000-62.5%$37/sqft |
Source: RE/MAX Professionals #DCDC344222 Report a problem | ||
| 10/30/2014 | Listing removed | $80,000$98/sqft |
Source: CityDwellers LLC #DC8357289 Report a problem | ||
| 5/23/2014 | Listed for sale | $80,000$98/sqft |
Source: CityDwellers LLC #DC8357289 Report a problem | ||
| 1/30/2014 | Listing removed | $80,000$98/sqft |
Source: Fairfax Realty,Inc. #DC8258929 Report a problem | ||
| 1/24/2014 | Listed for sale | $80,000-33.3%$98/sqft |
Source: Fairfax Realty,Inc. #DC8258929 Report a problem | ||
| 7/31/2013 | Listing removed | $1,000$1/sqft |
Source: Golphin Properties, LLC Report a problem | ||
| 7/14/2013 | Price change | $1,000-20%$1/sqft |
Source: Golphin Properties, LLC Report a problem | ||
| 7/11/2013 | Listing removed | $120,000$147/sqft |
Source: Owner Report a problem | ||
| 6/18/2013 | Price change | $120,000-7.7%$147/sqft |
Source: Owner Report a problem | ||
| 5/29/2013 | Listed for rent | $1,250$2/sqft |
Source: Golphin Properties, LLC Report a problem | ||
| 5/9/2013 | Listed for sale | $130,000$159/sqft |
Source: Owner Report a problem | ||
| Year | Property taxes | Tax assessment |
|---|---|---|
| 2025 | $736 +1.9% | $102,270 +2.1% |
| 2024 | $723 +20.7% | $100,200 +17.6% |
| 2023 | $599 +5.4% | $85,170 +5.7% |
| 2022 | $568 -4.4% | $80,600 -3.1% |
| 2021 | $594 -7.3% | $83,180 +10.3% |
| 2020 | $641 -4.1% | $75,430 -4.1% |
| 2018 | $669 +1.1% | $78,680 +1.1% |
| 2017 | $662 +0.2% | $77,830 +0.2% |
| 2016 | $660 | $77,670 |
| 2015 | $660 -10.8% | $77,670 -10.8% |
| 2014 | $740 -9.7% | $87,110 -9.7% |
| 2013 | $820 +1.2% | $96,430 +1.2% |
| 2012 | $810 | $95,280 |
| 2011 | $810 -7.2% | $95,280 -7.2% |
| 2010 | $873 -13.7% | $102,690 -13.7% |
| 2009 | $1,012 +23.7% | $119,030 +28.1% |
| 2007 | $818 +73.2% | $92,950 +81% |
| 2006 | $472 +36.8% | $51,340 +42.7% |
| 2005 | $345 +58.9% | $35,970 +58.9% |
| 2004 | $217 -38.3% | $22,640 -38.3% |
| 2003 | $353 | $36,720 |
| 2002 | $353 +1.5% | $36,720 +21.6% |
| 2001 | $347 | $30,192 |
Find assessor info on the county website
Source: Bright MLS. This data may not be complete. We recommend contacting the local school district to confirm school assignments for this home.