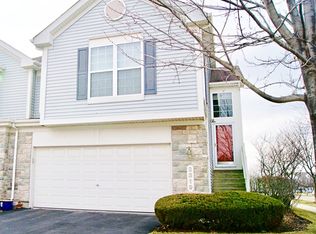
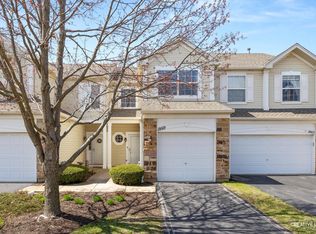
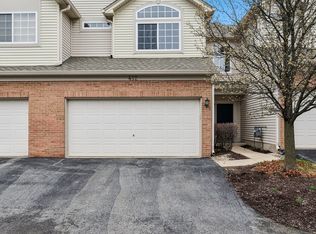
$308,100
3 bd|2 ba|1.5k sqft
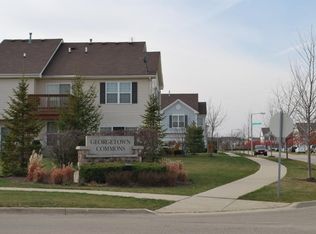
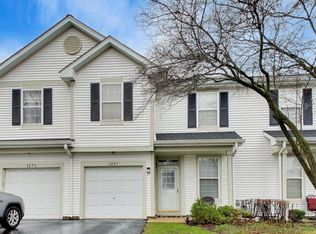
2323 Georgetown Cir, Aurora, IL 60503
Off Market
Likely to sell faster than
Zillow last checked:
Listing updated:
Sarah Diana 630-205-1999,
@properties Christies International Real Estate
Not available
Estimated sales range
Not available
Not available
| Date | Event | Price |
|---|---|---|
| 4/2/2026 | Contingent | $339,900$191/sqft |
Source: | ||
| 3/29/2026 | Listed for sale | $339,900+99.9%$191/sqft |
Source: | ||
| 8/11/2016 | Sold | $170,000+47.7%$95/sqft |
Source: Public Record Report a problem | ||
| 3/16/2016 | Sold | $115,100-42.2%$65/sqft |
Source: Public Record Report a problem | ||
| 12/11/2015 | Listing removed | -- |
Source: Auction.com Report a problem | ||
| 11/10/2015 | Listed for sale | -- |
Source: Auction.com Report a problem | ||
| 8/23/2011 | Listing removed | $1,600$1/sqft |
Source: Coldwell Banker Residential Brokerage - Naperville #07857036 Report a problem | ||
| 7/16/2011 | Listed for rent | $1,600$1/sqft |
Source: Coldwell Banker Residential Brokerage - Naperville #07857036 Report a problem | ||
| 7/2/2010 | Listing removed | $199,000$112/sqft |
Source: NRT Chicago #07427919 Report a problem | ||
| 1/30/2010 | Listed for sale | $199,000-9.5%$112/sqft |
Source: NRT Chicago #07427919 Report a problem | ||
| 5/30/2009 | Listing removed | $219,900$123/sqft |
Source: Homes.com #06990517 Report a problem | ||
| 5/16/2009 | Price change | $219,900-2.7%$123/sqft |
Source: Homes.com #06990517 Report a problem | ||
| 1/18/2009 | Price change | $225,900-1.7%$127/sqft |
Source: Homes.com #06990517 Report a problem | ||
| 10/6/2008 | Listed for sale | $229,900+7.7%$129/sqft |
Source: Homes.com #06990517 Report a problem | ||
| 7/13/2004 | Sold | $213,500$120/sqft |
Source: Public Record Report a problem | ||
| Year | Property taxes | Tax assessment |
|---|---|---|
| 2023 | $6,642 +8.8% | $77,676 +15.3% |
| 2022 | $6,105 +0.8% | $67,347 +5% |
| 2021 | $6,056 +4.5% | $64,140 +1.6% |
| 2020 | $5,794 -4.1% | $63,124 +2.9% |
| 2019 | $6,043 +16.4% | $61,345 +18.2% |
| 2018 | $5,189 +1% | $51,908 +2.6% |
| 2017 | $5,136 +1.1% | $50,568 +2.2% |
| 2016 | $5,081 -16% | $49,480 +4% |
| 2015 | $6,053 | $47,577 -8.7% |
| 2014 | $6,053 +2.3% | $52,130 |
| 2013 | $5,917 -14% | $52,130 -16.1% |
| 2012 | $6,884 +13.5% | $62,129 -1.1% |
| 2011 | $6,066 +3% | $62,840 -5% |
| 2010 | $5,891 +8.6% | $66,175 -1.7% |
| 2009 | $5,424 +0.8% | $67,320 |
| 2008 | $5,381 | $67,320 -2.4% |
| 2007 | -- | $68,970 -1.8% |
| 2006 | $5,727 -27.5% | $70,248 +2.8% |
| 2005 | $7,896 | $68,327 |
Find assessor info on the county website
Source: MRED as distributed by MLS GRID. This data may not be complete. We recommend contacting the local school district to confirm school assignments for this home.
A local agent can set up tours, give advice and negotiate with sellers.