$248,000
2 bd|2 ba|1.4k sqft
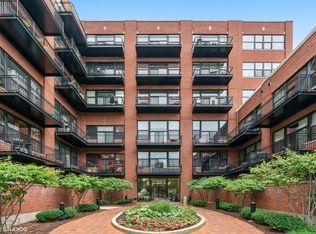
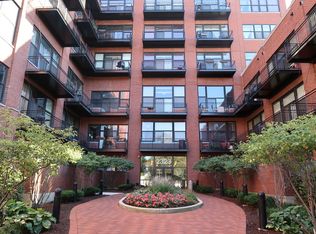
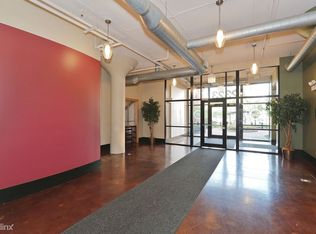
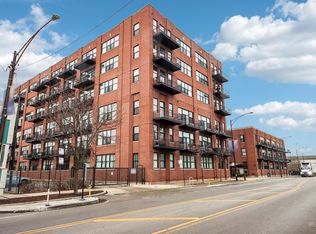
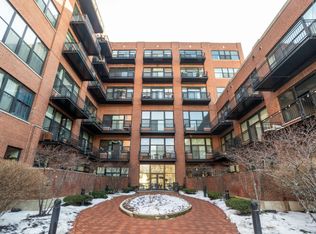
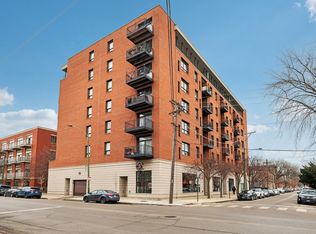
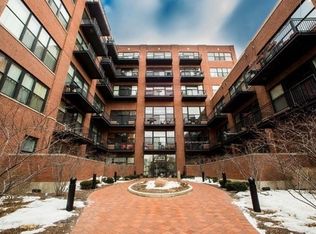
2323 W Pershing Rd APT 330, Chicago, IL 60609
Off Market
Likely to sell faster than
Zillow last checked: 8 hours ago
Listing updated: February 16, 2026 at 10:06pm
Mark Javier 773-809-5463,
Chicagoland Brokers, Inc.
Not available
Estimated sales range
Not available
Not available
| Date | Event | Price |
|---|---|---|
| 2/11/2026 | Listed for sale | $245,000-2.1%$188/sqft |
Source: | ||
| 8/24/2021 | Sold | $250,350+0.1%$193/sqft |
Source: | ||
| 7/27/2021 | Pending sale | $249,999$192/sqft |
Source: | ||
| 7/9/2021 | Listed for sale | $249,999+100%$192/sqft |
Source: | ||
| 12/6/2017 | Listing removed | $1,650$1/sqft |
Source: Jameson Sothebys Intl Realty #09775052 Report a problem | ||
| 10/12/2017 | Listed for rent | $1,650+1.5%$1/sqft |
Source: Jameson Sothebys Intl Realty #09775052 Report a problem | ||
| 10/27/2016 | Listing removed | $1,625+1.6%$1/sqft |
Source: Jameson Sothebys Intl Realty #09304979 Report a problem | ||
| 2/6/2015 | Listing removed | $1,600$1/sqft |
Source: Jameson Real Estate LLC #08801794 Report a problem | ||
| 12/16/2014 | Listed for rent | $1,600+3.2%$1/sqft |
Source: Jameson Real Estate LLC #08801794 Report a problem | ||
| 10/14/2014 | Listing removed | $1,550$1/sqft |
Source: Charles Rutenberg Realty #08663162 Report a problem | ||
| 9/24/2014 | Price change | $1,550-8.8%$1/sqft |
Source: Charles Rutenberg Realty #08663162 Report a problem | ||
| 7/4/2014 | Listed for rent | $1,700$1/sqft |
Source: Charles Rutenberg Realty #08663162 Report a problem | ||
| 6/30/2014 | Sold | $125,000-16.6%$96/sqft |
Source: | ||
| 10/23/2013 | Listing removed | $149,900$115/sqft |
Source: Homepath #08419754 Report a problem | ||
| 9/19/2013 | Price change | $149,900-21.5%$115/sqft |
Source: Homepath #08419754 Report a problem | ||
| 8/14/2013 | Listed for sale | $191,000$147/sqft |
Source: Homepath #08419754 Report a problem | ||
| Year | Property taxes | Tax assessment |
|---|---|---|
| 2023 | $4,111 +3.1% | $22,798 |
| 2022 | $3,986 -13.1% | $22,798 |
| 2021 | $4,585 +29.4% | $22,798 +43.3% |
| 2020 | $3,543 -2% | $15,905 -11.6% |
| 2019 | $3,614 +1.7% | $17,990 |
| 2018 | $3,554 +40% | $17,990 +52.6% |
| 2017 | $2,538 +7.5% | $11,792 |
| 2016 | $2,362 +9.3% | $11,792 |
| 2015 | $2,161 +4.8% | $11,792 +6.1% |
| 2014 | $2,062 +2% | $11,112 |
| 2013 | $2,021 -7.6% | $11,112 -8.8% |
| 2012 | $2,187 +22% | $12,190 +10.1% |
| 2011 | $1,793 -0.4% | $11,067 |
| 2010 | $1,801 -15.7% | $11,067 -19.3% |
| 2009 | $2,137 -46.6% | $13,707 -50.9% |
| 2008 | $4,006 +3.5% | $27,925 +2.5% |
| 2007 | $3,869 | $27,239 |
Find assessor info on the county website
Source: MRED as distributed by MLS GRID. This data may not be complete. We recommend contacting the local school district to confirm school assignments for this home.