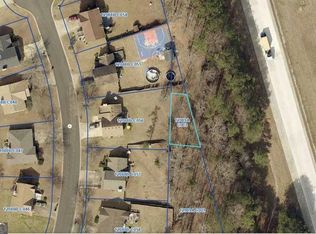
Vacant residential lot located in an established Decatur neighborhood. The property is not buildable under current zoning regulations and would require a variance approval to construct a residence. This lot may be suitable for investors, builders familiar with the entitlement process, or adjacent property owners seeking additional land. Conveniently located near downtown Decatur, shopping, dining, and major roadways. Buyer to conduct all due diligence and verify zoning, variance requirements, and allowable uses.
Pending
Street View
$7,000
2288 Troutdale Dr, Decatur, GA 30032
--beds
0baths
0.65Acres
Est.:
VacantLand
Built in ----
0.65 Acres Lot
$-- Zestimate®
$4/sqft
$-- HOA
What's special
Established decatur neighborhood
- 42 days |
- 19 |
- 0 |
Listed by:
Property Owner (404) 822-0726
Facts & features
Interior
Bedrooms & bathrooms
- Bathrooms: 0
Interior area
- Total interior livable area: 1,808 sqft
Property
Lot
- Size: 0.65 Acres
Details
- Parcel number: 1513301156
Community & HOA
Location
- Region: Decatur
Financial & listing details
- Price per square foot: $4/sqft
- Tax assessed value: $29,500
- Annual tax amount: $514
- Date on market: 2/6/2026
Property Owner
Property Owner
(404) 822-0726
By pressing Contact owner, you agree that the property owner identified above may call/text you about your search, which may involve use of automated means and pre-recorded/artificial voices. You don't need to consent as a condition of buying any property, goods, or services. Message/data rates may apply. You also agree to our Terms of Use. Zillow does not endorse any real estate professionals. We may share information about your recent and future site activity with your agent to help them understand what you're looking for in a home.
Estimated market value
Not available
Estimated sales range
Not available
$1,359/mo
Price history
Price history
| Date | Event | Price |
|---|---|---|
| 2/17/2026 | Pending sale | $7,000$4/sqft |
Source: Owner Report a problem | ||
| 2/6/2026 | Listed for sale | $7,000-66.7%$4/sqft |
Source: Owner Report a problem | ||
| 6/3/2025 | Listing removed | $21,000$12/sqft |
Source: | ||
| 2/10/2025 | Price change | $21,000+61.5%$12/sqft |
Source: | ||
| 9/22/2024 | Price change | $13,000-31.6%$7/sqft |
Source: | ||
| 8/26/2024 | Listed for sale | $19,000$11/sqft |
Source: | ||
| 8/20/2024 | Contingent | $19,000$11/sqft |
Source: | ||
| 8/20/2024 | Pending sale | $19,000$11/sqft |
Source: | ||
| 7/22/2024 | Price change | $19,000-24%$11/sqft |
Source: | ||
| 6/14/2024 | Listed for sale | $25,000+25%$14/sqft |
Source: | ||
| 4/15/2024 | Sold | $20,000-14.9%$11/sqft |
Source: | ||
| 4/12/2024 | Pending sale | $23,500$13/sqft |
Source: | ||
| 1/30/2024 | Price change | $23,500-7.8%$13/sqft |
Source: | ||
| 11/4/2023 | Listed for sale | $25,500+2450%$14/sqft |
Source: | ||
| 10/27/2023 | Sold | $1,000$1/sqft |
Source: Public Record Report a problem | ||
Public tax history
Public tax history
| Year | Property taxes | Tax assessment |
|---|---|---|
| 2025 | $514 -0.2% | $11,800 |
| 2024 | $516 -0.2% | $11,800 |
| 2023 | $517 +2.6% | $11,800 +2.8% |
| 2022 | $504 +4.4% | $11,480 +4.4% |
| 2021 | $483 | $11,000 |
| 2020 | $483 -87.7% | $11,000 |
| 2019 | $3,932 +15.7% | $11,000 +195.7% |
| 2018 | $3,398 +6.7% | $3,720 |
| 2017 | $3,184 +1836.9% | $3,720 |
| 2016 | $164 | $3,720 -6.1% |
| 2014 | $164 | $3,960 |
| 2013 | -- | $3,960 |
| 2012 | -- | $3,960 |
| 2011 | -- | $3,960 |
| 2010 | $159 -2.4% | $3,960 |
| 2009 | $163 +2% | $3,960 |
| 2008 | $160 +2.5% | $3,960 |
| 2007 | $156 | $3,960 |
| 2006 | $156 +1.5% | $3,960 |
| 2005 | $153 | $3,960 |
| 2004 | $153 -36.9% | $3,960 -46.2% |
| 2003 | $243 +95.8% | $7,360 +124.4% |
| 2002 | $124 +1.5% | $3,280 |
| 2001 | $122 | $3,280 |
Find assessor info on the county website
BuyAbility℠ payment
Est. payment
$42/mo
Principal & interest
$36
Property taxes
$6
More affordability tools
Climate risks
Neighborhood: Candler-Mcafee
Nearby schools
GreatSchools rating
- 2/10Snapfinger Elementary SchoolGrades: PK-5Distance: 0.7 mi
- 3/10Columbia Middle SchoolGrades: 6-8Distance: 1.8 mi
- 2/10Columbia High SchoolGrades: 9-12Distance: 0.5 mi

- Georgia
- Dekalb County
- Decatur
- 30032
- Candler-Mcafee
- 2288 Troutdale Dr
Nearby cities
Nearby neighborhoods
Nearby zip codes
Other Decatur Topics
