$202,900
3 bd|3 ba|1.6k sqft
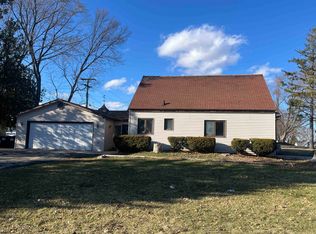
2228 Cross St, Freeport, IL 61032
Off Market
Likely to sell faster than
Zillow last checked: 7 hours ago
Listing updated: March 11, 2026 at 09:19am
Ryan Wagand (815)266-1721,
Real Broker LLC
Not available
Estimated sales range
Not available
Not available
| Date | Event | Price |
|---|---|---|
| 2/9/2026 | Pending sale | $169,900$123/sqft |
Source: | ||
| 1/26/2026 | Price change | $169,900-5.6%$123/sqft |
Source: | ||
| 1/15/2026 | Price change | $180,000-5.3%$131/sqft |
Source: | ||
| 1/12/2026 | Price change | $190,000-5%$138/sqft |
Source: | ||
| 1/6/2026 | Listed for sale | $200,000+48.1%$145/sqft |
Source: | ||
| 6/16/2023 | Sold | $135,000$98/sqft |
Source: | ||
| 5/15/2023 | Pending sale | $135,000$98/sqft |
Source: | ||
| 4/24/2023 | Listed for sale | $135,000+53.4%$98/sqft |
Source: | ||
| 4/21/2017 | Sold | $88,000-2.1%$64/sqft |
Source: | ||
| 2/26/2017 | Pending sale | $89,900$65/sqft |
Source: BARNES REALTY, INC. #20170111 Report a problem | ||
| 1/30/2017 | Listed for sale | $89,900$65/sqft |
Source: BARNES REALTY, INC. #20170111 Report a problem | ||
| 12/16/2016 | Listing removed | $89,900$65/sqft |
Source: PREFERRED REAL ESTATE OF ILLINOIS #20161639 Report a problem | ||
| 11/21/2016 | Price change | $89,900-4.4%$65/sqft |
Source: PREFERRED REAL ESTATE OF ILLINOIS #20161639 Report a problem | ||
| 10/3/2016 | Price change | $94,000-5.1%$68/sqft |
Source: PREFERRED REAL ESTATE OF ILLINOIS #20161639 Report a problem | ||
| 8/15/2016 | Listed for sale | $99,000+3.7%$72/sqft |
Source: PREFERRED REAL ESTATE OF ILLINOIS #20161639 Report a problem | ||
| 4/15/2014 | Sold | $95,500-21.1%$69/sqft |
Source: Agent Provided Report a problem | ||
| 6/23/2006 | Sold | $121,000$88/sqft |
Source: Agent Provided Report a problem | ||
| Year | Property taxes | Tax assessment |
|---|---|---|
| 2024 | $3,383 +10% | $40,657 +16.1% |
| 2023 | $3,075 +2.9% | $35,022 +3.6% |
| 2022 | $2,989 +9.1% | $33,814 +9.7% |
| 2021 | $2,740 -11.4% | $30,833 -7% |
| 2020 | $3,092 +1.4% | $33,158 +2% |
| 2019 | $3,049 +1.2% | $32,508 +1% |
| 2018 | $3,013 +0.1% | $32,187 |
| 2017 | $3,008 -6.2% | $32,187 -6.2% |
| 2016 | $3,208 +2.6% | $34,328 +1.5% |
| 2015 | $3,127 +2.4% | $33,821 -4.7% |
| 2013 | $3,055 | $35,494 -8.8% |
| 2010 | -- | $38,913 |
| 2009 | -- | $38,913 |
| 2008 | -- | $38,913 |
Find assessor info on the county website
Source: MRED as distributed by MLS GRID. This data may not be complete. We recommend contacting the local school district to confirm school assignments for this home.