$262,900
3 bd|1 ba|970 sqft
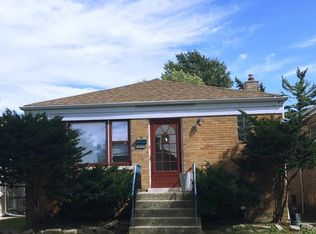
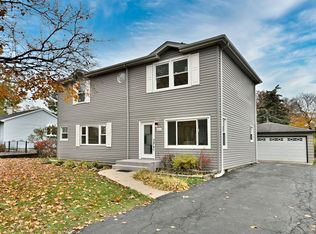
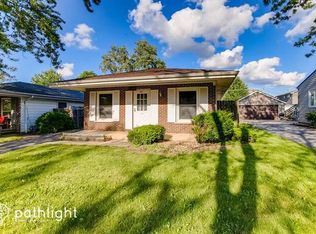
2252 Northgate Ave, North Riverside, IL 60546
Off Market
Zillow last checked: 8 hours ago
Listing updated: February 24, 2026 at 04:41pm
Esmeralda Gil 630-235-9093,
WE Realty
Not available
Estimated sales range
Not available
Not available
| Date | Event | Price |
|---|---|---|
| 2/25/2026 | Contingent | $695,000$232/sqft |
Source: | ||
| 2/24/2026 | Listed for sale | $695,000$232/sqft |
Source: | ||
| 1/29/2026 | Contingent | $695,000$232/sqft |
Source: | ||
| 10/29/2025 | Listed for sale | $695,000+208.9%$232/sqft |
Source: | ||
| 9/25/2024 | Sold | $225,000-9.6%$75/sqft |
Source: | ||
| 8/30/2024 | Pending sale | $249,000$83/sqft |
Source: | ||
| 8/30/2024 | Listed for sale | $249,000+9.8%$83/sqft |
Source: | ||
| 2/22/2021 | Listing removed | -- |
Source: Zillow Rental Network Premium Report a problem | ||
| 10/21/2020 | Listed for rent | $1,900+5.8%$1/sqft |
Source: Home Partners of America LLC Report a problem | ||
| 1/28/2019 | Listing removed | $1,795$1/sqft |
Source: Chicago Retail Brokers Report a problem | ||
| 1/11/2019 | Price change | $1,795-5.3%$1/sqft |
Source: Chicago Retail Brokers Report a problem | ||
| 12/10/2018 | Listed for rent | $1,895$1/sqft |
Source: Chicago Retail Brokers Report a problem | ||
| 5/18/2015 | Sold | $226,750-9.3%$76/sqft |
Source: | ||
| 4/28/2015 | Pending sale | $249,900$83/sqft |
Source: Realty Executives Midwest #08874119 Report a problem | ||
| 3/28/2015 | Listed for sale | $249,900+13.6%$83/sqft |
Source: Realty Executives Midwest #08874119 Report a problem | ||
| 9/30/2008 | Sold | $220,000+54.9%$73/sqft |
Source: Public Record Report a problem | ||
| 10/4/1996 | Sold | $142,000$47/sqft |
Source: Public Record Report a problem | ||
| Year | Property taxes | Tax assessment |
|---|---|---|
| 2023 | $7,793 +15.2% | $28,000 +37.5% |
| 2022 | $6,764 +3.9% | $20,361 |
| 2021 | $6,509 +21.7% | $20,361 |
| 2020 | $5,350 -0.5% | $20,361 -3.5% |
| 2019 | $5,374 +3% | $21,103 |
| 2018 | $5,219 +2.4% | $21,103 |
| 2017 | $5,094 +26% | $21,103 +33.6% |
| 2016 | $4,043 +3.6% | $15,790 |
| 2015 | $3,902 -0.4% | $15,790 |
| 2014 | $3,916 -1.5% | $15,790 -7.7% |
| 2013 | $3,976 +0.2% | $17,106 |
| 2012 | $3,968 +1.4% | $17,106 |
| 2011 | $3,915 -21.4% | $17,106 -23.3% |
| 2010 | $4,980 +4.7% | $22,300 |
| 2009 | $4,756 -7.8% | $22,300 -12% |
| 2008 | $5,156 +49.6% | $25,342 +14.2% |
| 2007 | $3,446 +12% | $22,195 |
| 2006 | $3,076 +16.8% | $22,195 |
| 2005 | $2,634 -3.1% | $22,195 +30.8% |
| 2004 | $2,717 +3.3% | $16,973 |
| 2003 | $2,631 +21.3% | $16,973 |
| 2002 | $2,168 +30.5% | $16,973 +22.9% |
| 2001 | $1,661 -4.2% | $13,811 |
| 2000 | $1,734 +0% | $13,811 |
| 1999 | $1,734 | $13,811 |
Find assessor info on the county website
Source: MRED as distributed by MLS GRID. This data may not be complete. We recommend contacting the local school district to confirm school assignments for this home.