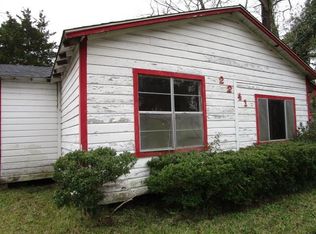
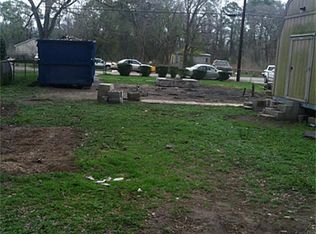
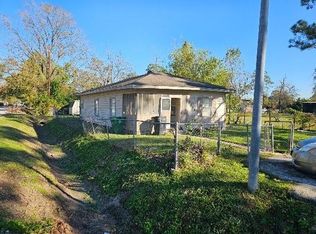
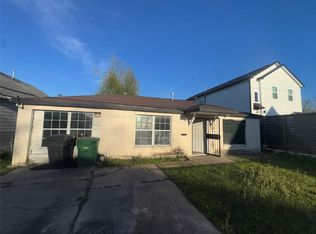
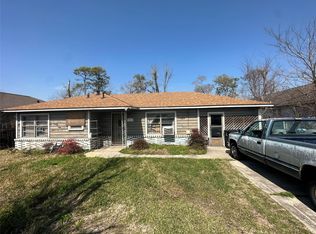
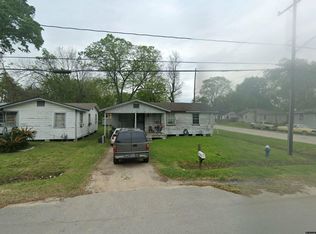
Ideal for developers, this property presents a fantastic opportunity with a repairable home and the potential to develop 2 to 4 units. Take advantage of the area’s ongoing growth and unlock its full potential. Don’t let this incredible chance pass you by!
For sale
Price cut: $2.5K (12/31)
$140,000
2237 Wilburforce St, Houston, TX 77091
3beds
1,296sqft
Est.:
Other
Built in 1949
5,375.3 Square Feet Lot
$78,400 Zestimate®
$108/sqft
$-- HOA
What's special
- 433 days |
- 252 |
- 6 |
Zillow last checked: 7 hours ago
Listed by:
Deon Clewis,
EXIT REALTY 360
Source: EXIT Realty broker feed,MLS#: 50678128
Tour with a local agent
Facts & features
Interior
Bedrooms & bathrooms
- Bedrooms: 3
- Bathrooms: 2
- Full bathrooms: 2
Heating
- Natural Gas
Cooling
- Other
Features
- Basement:
- Has fireplace: No
Interior area
- Total structure area: 1,296
- Total interior livable area: 1,296 sqft
Video & virtual tour
Property
Lot
- Size: 5,375.3 Square Feet
Details
- Parcel number: 0814320000025
Construction
Type & style
- Home type: SingleFamily
- Property subtype: Other
Condition
- Year built: 1949
Community & HOA
Location
- Region: Houston
Financial & listing details
- Price per square foot: $108/sqft
- Tax assessed value: $149,569
- Annual tax amount: $1,876
- Date on market: 1/22/2025
- Lease term: Contact For Details
Estimated market value
$78,400
$72,000 - $85,000
$1,811/mo
Price history
Price history
| Date | Event | Price |
|---|---|---|
| 1/7/2026 | Pending sale | $95,000$73/sqft |
Source: | ||
| 12/31/2025 | Price change | $95,000-2.6%$73/sqft |
Source: | ||
| 12/17/2025 | Price change | $97,500-7.1%$75/sqft |
Source: | ||
| 12/4/2025 | Price change | $105,000-2.8%$81/sqft |
Source: | ||
| 12/1/2025 | Price change | $108,000-1.8%$83/sqft |
Source: | ||
| 11/4/2025 | Price change | $110,000-12%$85/sqft |
Source: | ||
| 9/22/2025 | Price change | $125,000-10.7%$96/sqft |
Source: | ||
| 9/16/2025 | Price change | $140,000+7.7%$108/sqft |
Source: EXIT Realty broker feed #50678128 Report a problem | ||
| 8/27/2025 | Price change | $130,000-7.1%$100/sqft |
Source: | ||
| 7/24/2025 | Listed for sale | $140,000$108/sqft |
Source: | ||
| 7/23/2025 | Pending sale | $140,000$108/sqft |
Source: | ||
| 7/9/2025 | Price change | $140,000-7.9%$108/sqft |
Source: | ||
| 5/21/2025 | Price change | $152,000-3.5%$117/sqft |
Source: | ||
| 4/22/2025 | Price change | $157,500-7.3%$122/sqft |
Source: | ||
| 3/6/2025 | Price change | $169,900-8.2%$131/sqft |
Source: | ||
| 1/30/2025 | Price change | $185,000+12.1%$143/sqft |
Source: | ||
| 1/22/2025 | Listed for sale | $165,000$127/sqft |
Source: | ||
Public tax history
Public tax history
| Year | Property taxes | Tax assessment |
|---|---|---|
| 2025 | $1,876 | $149,569 +3.9% |
| 2024 | -- | $143,890 +3.7% |
| 2023 | -- | $138,703 +64.5% |
| 2022 | -- | $84,340 +64.5% |
| 2021 | -- | $51,264 -8.9% |
| 2020 | -- | $56,260 |
| 2019 | -- | $56,260 +16.2% |
| 2018 | -- | $48,414 |
| 2017 | -- | $48,414 |
| 2016 | -- | $48,414 +49.1% |
| 2015 | $584 | $32,476 |
| 2014 | $584 | $32,476 |
| 2013 | -- | $32,476 -46.8% |
| 2012 | -- | $60,999 |
| 2011 | -- | $60,999 |
| 2010 | -- | $60,999 |
| 2009 | -- | $60,999 |
| 2008 | -- | $60,999 |
| 2007 | -- | $60,999 +122.1% |
| 2006 | -- | $27,467 |
| 2005 | -- | -- |
| 2004 | -- | $22,700 +9.7% |
| 2003 | -- | $20,700 |
| 2002 | -- | $20,700 |
| 2001 | -- | $20,700 +191.5% |
| 2000 | -- | $7,100 |
Find assessor info on the county website
BuyAbility℠ payment
Est. payment
$928/mo
Principal & interest
$724
Property taxes
$204
More affordability tools
Climate risks
Neighborhood: Acres Home
Nearby schools
GreatSchools rating
- NAReece AcademyGrades: PK-KDistance: 1.1 mi
- 4/10Drew AcademyGrades: 7-8Distance: 0.5 mi
- 5/10Carver High School For Applied Tech/EngineGrades: 9-12Distance: 1 mi
Local experts in 77091
- Texas
- Harris County
- Houston
- 77091
- Acres Home
- 2237 Wilburforce St
Nearby cities
Nearby neighborhoods
Nearby zip codes
Other Houston Topics
