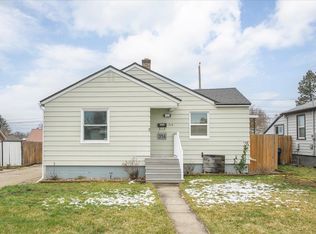
Cute Starter home or investors special! Add egress window for 3rd room in basement to create conforming bedroom. 1 car garage has storage and work bench along with an extra room.
Pre-foreclosure
Est. $314,800
2203 E Sanson Ave, Spokane, WA 99207
2beds
1,283sqft
SingleFamily
Built in 1926
6,098 Square Feet Lot
$314,800 Zestimate®
$245/sqft
$-- HOA
Overview
- 272 days |
- 15 |
- 0 |
Facts & features
Interior
Bedrooms & bathrooms
- Bedrooms: 2
- Bathrooms: 1
- Full bathrooms: 1
Heating
- Forced air
Cooling
- Central
Features
- Basement: Partially finished
- Has fireplace: Yes
Interior area
- Total interior livable area: 1,283 sqft
Property
Parking
- Total spaces: 1
- Parking features: Garage - Detached
Lot
- Size: 6,098 Square Feet
Details
- Parcel number: 363340418
Construction
Type & style
- Home type: SingleFamily
Materials
- Roof: Built-up
Condition
- Year built: 1926
Community & HOA
Location
- Region: Spokane
Financial & listing details
- Price per square foot: $245/sqft
- Tax assessed value: $320,200
- Annual tax amount: $3,180
Visit our professional directory to find a foreclosure specialist in your area that can help with your home search.
Find a foreclosure agentForeclosure details
Estimated market value
$314,800
$299,000 - $331,000
$1,525/mo
Price history
Price history
| Date | Event | Price |
|---|---|---|
| 9/10/2021 | Sold | $312,000+7.6%$243/sqft |
Source: | ||
| 8/9/2021 | Pending sale | $290,000$226/sqft |
Source: | ||
| 8/6/2021 | Listed for sale | $290,000$226/sqft |
Source: | ||
| 8/3/2021 | Pending sale | $290,000$226/sqft |
Source: | ||
| 7/29/2021 | Listed for sale | $290,000+119.7%$226/sqft |
Source: | ||
| 8/18/2020 | Sold | $132,000-5.6%$103/sqft |
Source: | ||
| 8/3/2020 | Price change | $139,900-6.7%$109/sqft |
Source: RE/MAX Inland Empire #202018042 Report a problem | ||
| 8/3/2020 | Pending sale | $149,950$117/sqft |
Source: RE/MAX Inland Empire #202018042 Report a problem | ||
| 6/30/2020 | Listed for sale | $149,950+66.8%$117/sqft |
Source: RE/MAX Inland Empire #202018042 Report a problem | ||
| 9/30/2017 | Listing removed | $89,900$70/sqft |
Source: M J McAdams Realty #201720806 Report a problem | ||
| 8/2/2017 | Price change | $89,900-2.3%$70/sqft |
Source: M J McAdams Realty #201720806 Report a problem | ||
| 7/13/2017 | Listed for sale | $92,000+21.1%$72/sqft |
Source: M J McAdams Realty #201720806 Report a problem | ||
| 3/2/2004 | Sold | $76,000+72.7%$59/sqft |
Source: Public Record Report a problem | ||
| 3/30/2000 | Sold | $44,000-22.7%$34/sqft |
Source: Public Record Report a problem | ||
| 8/3/1999 | Sold | $56,950-22.8%$44/sqft |
Source: Public Record Report a problem | ||
| 12/12/1997 | Sold | $73,800$58/sqft |
Source: Public Record Report a problem | ||
Public tax history
Public tax history
| Year | Property taxes | Tax assessment |
|---|---|---|
| 2024 | $3,180 -1.8% | $320,200 -4.2% |
| 2023 | $3,239 +5.8% | $334,100 +6.8% |
| 2022 | $3,061 +105.7% | $312,700 +128.6% |
| 2021 | $1,488 +693.5% | $136,800 +20.1% |
| 2020 | $187 -1% | $113,900 +10.4% |
| 2019 | $189 | $103,200 +11.2% |
| 2018 | $189 -4% | $92,800 +9.6% |
| 2017 | $197 +4.3% | $84,700 +6.8% |
| 2016 | $189 +26% | $79,300 +1.4% |
| 2015 | $150 | $78,200 |
| 2014 | $150 | $78,200 |
| 2013 | $150 -87.6% | -- |
| 2011 | $1,209 +0.9% | -- |
| 2010 | $1,199 | -- |
| 2009 | $1,199 +27% | -- |
| 2008 | $944 | -- |
| 2007 | $944 +5.7% | $84,600 |
| 2005 | $893 +3.7% | -- |
| 2004 | $861 +3.4% | -- |
| 2003 | $832 | -- |
| 2002 | $832 +0.4% | -- |
| 2001 | $829 -4.9% | $56,200 |
| 1999 | $871 | $56,200 |
Find assessor info on the county website
BuyAbility℠ payment
Estimated monthly payment
All calculations are estimates and provided by Zillow, Inc. for informational purposes only. Actual amounts may vary.
HOA fees may include property taxes on listings classified as Co-Ops. Contact the listing agent and/or owner for fee details.
Mortgage interest rates are dependent on a number of factors, including credit score, down payment, and repayment length. Interest rate data provided by Zillow Group Marketplace, Inc. as of 1/1/1970 from various mortgage lenders with which we have lead or other similar arrangements; the Estimated Payment is an average of those rates.
See how much you could borrow to make a competitive offer.
Boost your down payment with 6% savings match
Earn up to a 6% match & get a competitive APY with a *. Zillow has partnered with to help get you home faster.
Learn more*Terms apply. Match provided by Foyer. Account offered by Pacific West Bank, Member FDIC.Climate risks
Neighborhood: Hillyard
Getting around
38 / 100
Some TransitNearby schools
GreatSchools rating
- 4/10Regal Elementary SchoolGrades: PK-5Distance: 0.7 mi
- 2/10Shaw Middle SchoolGrades: 6-8Distance: 0.8 mi
- 3/10Rogers High SchoolGrades: 9-12Distance: 0.7 mi
Schools provided by the listing agent
- Elementary: Regal
- Middle: Shaw
- High: Rogers
- District: Spokane Dist 81
Source: The MLS. This data may not be complete. We recommend contacting the local school district to confirm school assignments for this home.
- Washington
- Spokane County
- Spokane
- 99207
- Hillyard
- 2203 E Sanson Ave
Nearby cities
Nearby neighborhoods
Nearby zip codes
Other Spokane Topics
