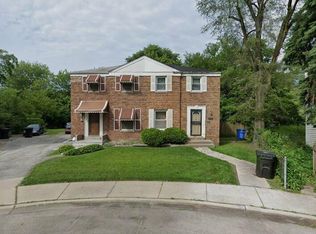
$85,500
2 bd|1 ba|1.2k sqft
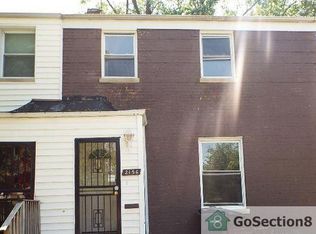
2156 E 97th Pl, Chicago, IL 60617
Off Market
Zillow last checked: 7 hours ago
Listing updated: March 20, 2026 at 10:06pm
Alisha Harris, ABR,SFR 708-317-8422,
Ellison Parker Realty
Not available
Estimated sales range
Not available
Not available
| Date | Event | Price |
|---|---|---|
| 3/15/2026 | Listed for sale | $55,000-6.8%$58/sqft |
Source: | ||
| 2/16/2026 | Listing removed | $58,999$62/sqft |
Source: | ||
| 10/31/2025 | Price change | $58,999-9.2%$62/sqft |
Source: | ||
| 9/11/2025 | Listed for sale | $65,000+242.1%$68/sqft |
Source: | ||
| 2/1/2013 | Listing removed | $19,000$20/sqft |
Source: Coldwell Banker Residential Brokerage - Evanston #08091661 Report a problem | ||
| 12/30/2012 | Price change | $19,000-35.6%$20/sqft |
Source: Coldwell Banker Residential Brokerage - Evanston #08091661 Report a problem | ||
| 9/12/2012 | Price change | $29,500-24.7%$31/sqft |
Source: Coldwell Banker Residential Brokerage - Evanston #08091661 Report a problem | ||
| 6/16/2012 | Price change | $39,200-1.8%$41/sqft |
Source: Coldwell Banker Residential Brokerage - Evanston #08091661 Report a problem | ||
| 9/10/2011 | Price change | $39,900-11.3%$42/sqft |
Source: Coldwell Banker Residential Brokerage - Evanston #07886171 Report a problem | ||
| 8/24/2011 | Price change | $45,000-6.1%$47/sqft |
Source: Coldwell Banker Residential Brokerage - Evanston #07886171 Report a problem | ||
| 1/1/2011 | Price change | $47,900-11.1%$50/sqft |
Source: NRT Chicago #07612912 Report a problem | ||
| 8/22/2010 | Price change | $53,900+7.8%$56/sqft |
Source: NRT Chicago #07612912 Report a problem | ||
| 7/2/2009 | Price change | $50,000-9.1%$52/sqft |
Source: Owner Report a problem | ||
| 6/4/2009 | Listed for sale | $55,000$58/sqft |
Source: Owner Report a problem | ||
| Year | Property taxes | Tax assessment |
|---|---|---|
| 2023 | $1,269 +2.5% | $5,999 |
| 2022 | $1,238 +2.3% | $5,999 |
| 2021 | $1,210 -17.4% | $5,999 -8.5% |
| 2020 | $1,464 -0.2% | $6,557 -10% |
| 2019 | $1,468 +1.7% | $7,286 |
| 2018 | $1,443 -14.2% | $7,286 -6.6% |
| 2017 | $1,682 +7.5% | $7,797 |
| 2016 | $1,565 +9.3% | $7,797 |
| 2015 | $1,432 +9.1% | $7,797 +10.5% |
| 2014 | $1,312 +2% | $7,055 |
| 2013 | $1,286 +1.4% | $7,055 |
| 2012 | $1,269 -17.8% | $7,055 -25.8% |
| 2011 | $1,544 -0.4% | $9,507 |
| 2010 | $1,550 +4.4% | $9,507 |
| 2009 | $1,485 +40% | $9,507 +28.8% |
| 2008 | $1,061 +1.1% | $7,380 |
| 2007 | $1,049 -18.3% | $7,380 -17.4% |
| 2006 | $1,285 +27.7% | $8,940 +45.4% |
| 2005 | $1,006 +1% | $6,147 |
| 2004 | $996 +2.2% | $6,147 |
| 2003 | $975 -0.7% | $6,147 +12.7% |
| 2002 | $981 +3.7% | $5,454 |
| 2001 | $946 +6.9% | $5,454 |
| 2000 | $885 +80.2% | $5,454 +18.6% |
| 1999 | $491 | $4,599 |
Find assessor info on the county website
Source: MRED as distributed by MLS GRID. This data may not be complete. We recommend contacting the local school district to confirm school assignments for this home.