Buy This Property on Auction.com.
This foreclosure property offered by Auction.com may sell below market value.
SAVE THIS PROPERTY NOW on Auction.com to receive alerts about auction dates and status changes.
Auction.com is the nation's largest online real estate auction marketplace with over half-a-million properties sold.
Auction

Est. $177,400
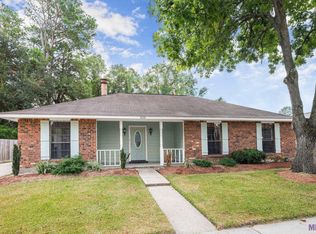
2124 General Taylor Ave, Baton Rouge, LA 70810
3beds
2baths
1,428sqft
Single Family Residence
Built in 1979
7,840.8 Square Feet Lot
$177,400 Zestimate®
$--/sqft
$-- HOA
Overview
- 4 days |
- 17 |
- 0 |
Zillow last checked: 12 hours ago
Listed by:
Auction.com Customer Service,
Auction.com
Source: Auction.com 2
Facts & features
Interior
Bedrooms & bathrooms
- Bedrooms: 3
- Bathrooms: 2
Interior area
- Total structure area: 1,428
- Total interior livable area: 1,428 sqft
Property
Lot
- Size: 7,840.8 Square Feet
Details
- Parcel number: 03092542
- Special conditions: Auction
Construction
Type & style
- Home type: SingleFamily
- Property subtype: Single Family Residence
Condition
- Year built: 1979
Community & HOA
Location
- Region: Baton Rouge
Financial & listing details
- Tax assessed value: $164,220
- Annual tax amount: $1,186
- Date on market: 3/23/2026
- Lease term: Contact For Details
This listing is brought to you by Auction.com 2
View Auction DetailsEstimated market value
$177,400
$154,000 - $197,000
$1,828/mo
Public tax history
Public tax history
| Year | Property taxes | Tax assessment |
|---|---|---|
| 2024 | $1,186 +38.4% | $16,422 +21% |
| 2023 | $857 +2.7% | $13,570 |
| 2022 | $834 +1.6% | $13,570 |
| 2021 | $821 +0.8% | $13,570 |
| 2020 | $814 -37.5% | $13,570 +35.7% |
| 2019 | $1,303 +1.2% | $10,000 |
| 2018 | $1,288 +206% | $10,000 |
| 2017 | $421 | $10,000 +42.3% |
| 2016 | $421 +219% | $7,025 -29.8% |
| 2015 | $132 -67.6% | $10,000 |
| 2014 | $407 | $10,000 |
| 2013 | $407 -67% | $10,000 |
| 2012 | $1,232 +11.7% | $10,000 +14.3% |
| 2011 | $1,103 +1% | $8,750 |
| 2010 | $1,092 +691.7% | $8,750 |
| 2008 | $138 +315.4% | $8,750 +12.2% |
| 2007 | $33 -1.6% | $7,800 |
| 2006 | $34 -1.7% | $7,800 |
| 2005 | $34 +3.6% | $7,800 |
| 2004 | $33 -49.6% | $7,800 |
| 2003 | $66 +0% | $7,800 |
| 2002 | $66 +1.5% | $7,800 |
| 2001 | $65 +97.8% | $7,800 |
| 2000 | $33 | $7,800 |
Find assessor info on the county website
Climate risks
Neighborhood: South Burbank
Getting around
34 / 100
Car-DependentNearby schools
GreatSchools rating
- 7/10Magnolia Woods Elementary SchoolGrades: PK-5Distance: 2.3 mi
- 4/10Westdale Middle SchoolGrades: 6-8Distance: 6.2 mi
- 2/10Tara High SchoolGrades: 9-12Distance: 6.3 mi
- Louisiana
- East Baton Rouge Parish
- Baton Rouge
- 70810
- South Burbank
- 2124 General Taylor Ave
Nearby cities
Nearby neighborhoods
Nearby zip codes
Other Baton Rouge Topics
