$413,700
4 bd|3 ba|1.7k sqft
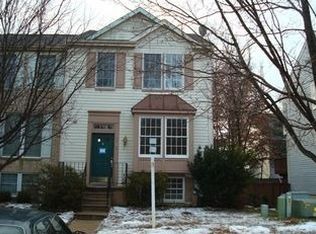
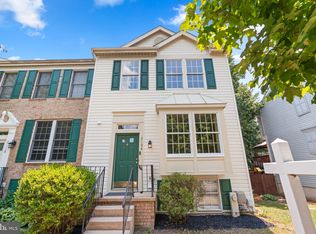
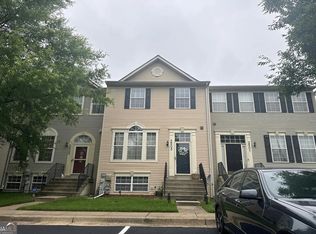
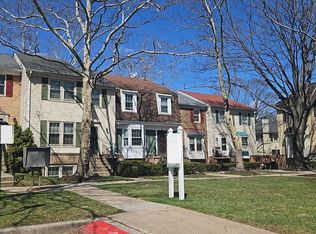
2106 Commissary Cir, Odenton, MD 21113
Off Market
Zillow last checked: 7 hours ago
Listing updated: March 31, 2026 at 03:10am
Darnell Harris 410-403-8387,
Coldwell Banker Realty 410-327-2200
$388,500
$369,000 - $408,000
$2,539/mo
| Date | Event | Price |
|---|---|---|
| 5/30/2025 | Pending sale | $200,000-23%$121/sqft |
Source: | ||
| 6/12/2023 | Listing removed | $259,900$157/sqft |
Source: | ||
| 5/31/2023 | Pending sale | $259,900$157/sqft |
Source: | ||
| 5/30/2023 | Listed for sale | $259,900-23.6%$157/sqft |
Source: | ||
| 4/13/2023 | Listing removed | -- |
Source: Owner Report a problem | ||
| 1/13/2023 | Listed for sale | $340,000+0.3%$206/sqft |
Source: Owner Report a problem | ||
| 12/31/2022 | Listing removed | $339,000$205/sqft |
Source: | ||
| 12/29/2022 | Listed for sale | $339,000+44.3%$205/sqft |
Source: | ||
| 11/30/2017 | Sold | $235,000+3.3%$142/sqft |
Source: Public Record Report a problem | ||
| 8/15/2017 | Price change | $227,525-5%$138/sqft |
Source: Cummings & Co Realtors #AA9941634 Report a problem | ||
| 7/13/2017 | Price change | $239,500-4.9%$145/sqft |
Source: Cummings & Co Realtors #AA9941634 Report a problem | ||
| 6/12/2017 | Price change | $251,900-4.9%$152/sqft |
Source: Cummings & Co Realtors #AA9941634 Report a problem | ||
| 5/9/2017 | Listed for sale | $264,900+3.9%$160/sqft |
Source: Cummings & Co Realtors #AA9941634 Report a problem | ||
| 12/1/2016 | Listing removed | $255,000$154/sqft |
Source: Meade Realty Inc #AA9693583 Report a problem | ||
| 7/1/2016 | Price change | $255,000-5.5%$154/sqft |
Source: Meade Realty Inc #AA9693583 Report a problem | ||
| 6/14/2016 | Listed for sale | $269,900+116.8%$163/sqft |
Source: Owner Report a problem | ||
| 10/4/1995 | Sold | $124,500$75/sqft |
Source: Public Record Report a problem | ||
| Year | Property taxes | Tax assessment |
|---|---|---|
| 2025 | $3,645 +8% | $324,900 +5.4% |
| 2024 | $3,376 +6% | $308,267 +5.7% |
| 2023 | $3,185 +10.8% | $291,633 +6% |
| 2022 | $2,874 +1.6% | $275,000 +1.6% |
| 2021 | $2,827 +1.6% | $270,567 +1.7% |
| 2020 | $2,784 +1.6% | $266,133 +1.7% |
| 2019 | $2,740 +7.7% | $261,700 +4.3% |
| 2018 | $2,544 +4% | $250,900 +4.5% |
| 2017 | $2,447 | $240,100 +4.7% |
| 2016 | -- | $229,300 +0.4% |
| 2015 | -- | $228,500 +0.4% |
| 2014 | -- | $227,700 +0.4% |
| 2013 | -- | $226,900 |
| 2012 | -- | $226,900 |
| 2011 | -- | $226,900 -27% |
| 2010 | -- | $310,620 +11.7% |
| 2009 | -- | $278,000 +13.3% |
| 2008 | -- | $245,380 +15.3% |
| 2007 | -- | $212,760 +14.4% |
| 2006 | -- | $185,920 +16.9% |
| 2005 | -- | $159,080 +20.3% |
| 2004 | -- | $132,240 +3.8% |
| 2003 | -- | $127,402 +3.9% |
| 2002 | -- | $122,566 +4.1% |
| 2001 | -- | $117,730 |
Find assessor info on the county website
Source: Bright MLS. This data may not be complete. We recommend contacting the local school district to confirm school assignments for this home.