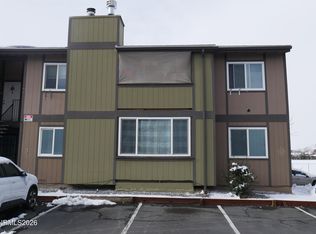
This 919 square foot townhome home has 2 bedrooms and 2.0 bathrooms. This home is located at 2101 Highview Ct #14, Reno, NV 89512.
Pre-foreclosure
Est. $210,800
2101 Highview Ct #14, Reno, NV 89512
2beds
919sqft
Townhouse
Built in 1984
43 Square Feet Lot
$210,800 Zestimate®
$229/sqft
$220/mo HOA
Overview
- 359 days |
- 11 |
- 0 |
Facts & features
Interior
Bedrooms & bathrooms
- Bedrooms: 2
- Bathrooms: 2
- Full bathrooms: 2
Heating
- Baseboard, Electric
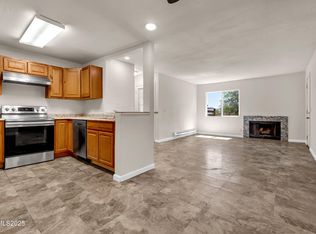
Appliances
- Included: Dishwasher, Dryer, Garbage disposal, Range / Oven, Refrigerator, Washer
- Laundry: In Hall
Features
- Flooring: Laminate, Linoleum / Vinyl
- Windows: Double Pane Windows, Blinds
- Has fireplace: Yes
Interior area
- Total interior livable area: 919 sqft
Property
Features
- Patio & porch: Covered, Yes
- Exterior features: Other, Wood
- Has view: Yes
- View description: Mountain
Lot
- Size: 43 Square Feet
- Topography: Level
Details
- Parcel number: 00428523
- Zoning: Mf30
- Special conditions: Standard
Construction
Type & style
- Home type: Townhouse
Materials
- Frame
- Roof: Composition
Condition
- Year built: 1984
Utilities & green energy
- Sewer: Public Sewer
- Utilities for property: Electricity Connected, Phone Connected, Cable Connected, Water Connected, Internet Available
Green energy
- Energy efficient items: Double Pane Windows
Community & HOA
Community
- Security: Smoke Detector(s)
HOA
- Has HOA: Yes
- Amenities included: Maintenance, Addl Parking, Exterior Maint, Landsc Maint Full
- HOA fee: $220 monthly
Location
- Region: Reno
Financial & listing details
- Price per square foot: $229/sqft
- Tax assessed value: $86,095
- Annual tax amount: $223
- Date available: 09/16/2020
Visit our professional directory to find a foreclosure specialist in your area that can help with your home search.
Find a foreclosure agentForeclosure details
Estimated market value
$210,800
$194,000 - $228,000
$1,546/mo
Price history
Price history
| Date | Event | Price |
|---|---|---|
| 6/25/2021 | Sold | $170,000+23.3%$185/sqft |
Source: Public Record Report a problem | ||
| 1/30/2021 | Listing removed | -- |
Source: Owner Report a problem | ||
| 12/18/2020 | Sold | $137,850+37.9%$150/sqft |
Source: | ||
| 12/5/2019 | Sold | $100,000+257.1%$109/sqft |
Source: Public Record Report a problem | ||
| 9/19/2017 | Sold | $28,000-77.4%$30/sqft |
Source: Public Record Report a problem | ||
| 10/24/2008 | Listing removed | $124,000$135/sqft |
Source: Owner Report a problem | ||
| 8/15/2008 | Price change | $124,000-1.6%$135/sqft |
Source: Owner Report a problem | ||
| 7/12/2007 | Listed for sale | $126,000+51.8%$137/sqft |
Source: Owner Report a problem | ||
| 4/27/2007 | Sold | $83,000+56.9%$90/sqft |
Source: Public Record Report a problem | ||
| 4/18/2003 | Sold | $52,900+655.7%$58/sqft |
Source: Public Record Report a problem | ||
| 9/25/1997 | Sold | $7,000$8/sqft |
Source: Public Record Report a problem | ||
Public tax history
Public tax history
| Year | Property taxes | Tax assessment |
|---|---|---|
| 2025 | $223 +2.7% | $30,133 -2.6% |
| 2024 | $217 -1.4% | $30,927 +7.4% |
| 2023 | $220 +7.5% | $28,809 +25.9% |
| 2022 | $205 +6.7% | $22,888 +12.9% |
| 2021 | $192 +4.7% | $20,268 +0.2% |
| 2020 | $183 -4.5% | $20,225 |
| 2019 | $192 +4.7% | $20,225 +33% |
| 2018 | $183 +8.8% | $15,205 -5.9% |
| 2017 | $168 | $16,154 +40% |
| 2016 | $168 | $11,542 +52.3% |
| 2015 | $168 +0% | $7,580 +5% |
| 2014 | $168 +2.9% | $7,221 +80.3% |
| 2013 | $164 | $4,005 |
| 2012 | -- | $4,005 -15% |
| 2011 | -- | $4,710 +1.4% |
| 2010 | -- | $4,645 -74.6% |
| 2009 | -- | $18,283 -7.4% |
| 2008 | -- | $19,737 |
| 2007 | -- | $19,737 +8% |
| 2006 | -- | $18,279 +8.5% |
| 2005 | -- | $16,849 +7.7% |
| 2004 | -- | $15,645 -1.1% |
| 2003 | -- | $15,825 +0.7% |
| 2002 | -- | $15,714 +12.5% |
| 2001 | -- | $13,964 |
Find assessor info on the county website
BuyAbility℠ payment
Estimated monthly payment
Boost your down payment with 6% savings match
Earn up to a 6% match & get a competitive APY with a *. Zillow has partnered with to help get you home faster.
Learn more*Terms apply. Match provided by Foyer. Account offered by Pacific West Bank, Member FDIC.Climate risks
Neighborhood: East University
Nearby schools
GreatSchools rating
- 5/10Rita Cannan Elementary SchoolGrades: PK-5Distance: 0.5 mi
- 5/10Fred W Traner Middle SchoolGrades: 6-8Distance: 0.8 mi
- 2/10Procter R Hug High SchoolGrades: 9-12Distance: 1.4 mi
Schools provided by the listing agent
- Elementary: Cannan
- Middle: Traner
- High: Hug
Source: The MLS. This data may not be complete. We recommend contacting the local school district to confirm school assignments for this home.