$180,500
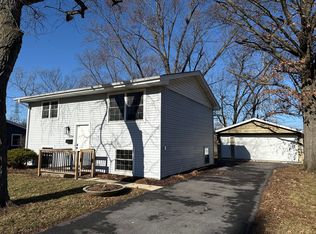
3 bd|1 ba|1.3k sqft
20805 Homeland Rd, Matteson, IL 60443
Off Market
Likely to sell faster than
Zillow last checked: 8 hours ago
Listing updated: February 27, 2026 at 07:11am
Robert Nowak 630-929-1100,
Charles Rutenberg Realty of IL
$222,200
$211,000 - $233,000
$2,612/mo
| Date | Event | Price |
|---|---|---|
| 2/27/2026 | Listed for sale | $224,900$110/sqft |
Source: | ||
| 2/24/2026 | Contingent | $224,900$110/sqft |
Source: | ||
| 2/18/2026 | Price change | $224,900-10%$110/sqft |
Source: | ||
| 2/6/2026 | Price change | $249,900-3.5%$122/sqft |
Source: | ||
| 1/16/2026 | Listed for sale | $259,000+118.6%$126/sqft |
Source: | ||
| 11/5/2025 | Listing removed | $3,310$2/sqft |
Source: Zillow Rentals Report a problem | ||
| 10/28/2025 | Listed for rent | $3,310+43.9%$2/sqft |
Source: Zillow Rentals Report a problem | ||
| 10/27/2022 | Listing removed | -- |
Source: Zillow Rental Network_1 Report a problem | ||
| 9/4/2022 | Listed for rent | $2,300+4.5%$1/sqft |
Source: Zillow Rental Network_1 Report a problem | ||
| 9/24/2020 | Listing removed | $2,200$1/sqft |
Source: Go Section8 Report a problem | ||
| 7/31/2020 | Listed for rent | $2,200$1/sqft |
Source: Go Section8 Report a problem | ||
| 8/7/2017 | Sold | $118,500+50%$58/sqft |
Source: Public Record Report a problem | ||
| 6/24/2016 | Sold | $79,000$38/sqft |
Source: | ||
| 6/23/2016 | Pending sale | $79,000$38/sqft |
Source: RE/MAX "10" OAK LAWN #09231857 Report a problem | ||
| 6/18/2016 | Listed for sale | $79,000$38/sqft |
Source: RE/MAX "10" OAK LAWN #09231857 Report a problem | ||
| 6/1/2016 | Pending sale | $79,000$38/sqft |
Source: RE/MAX "10" OAK LAWN #09231857 Report a problem | ||
| 5/20/2016 | Listed for sale | $79,000$38/sqft |
Source: RE/MAX "10" OAK LAWN #09231857 Report a problem | ||
| 3/23/2015 | Sold | $79,000-7.1%$38/sqft |
Source: Agent Provided Report a problem | ||
| 10/22/2014 | Listing removed | $85,000$41/sqft |
Source: Coldwell Banker Honig-Bell #08693030 Report a problem | ||
| 8/7/2014 | Listed for sale | $85,000+70%$41/sqft |
Source: Coldwell Banker Honig-Bell #08693030 Report a problem | ||
| 5/31/2013 | Sold | $50,000+0.1%$24/sqft |
Source: | ||
| 4/16/2013 | Listed for sale | $49,950-28.5%$24/sqft |
Source: Keller Williams Preferred Realty #08317402 Report a problem | ||
| 9/13/2012 | Listing removed | $69,890$34/sqft |
Source: RE/MAX Synergy #08018312 Report a problem | ||
| 3/16/2012 | Listed for sale | $69,890$34/sqft |
Source: RE/MAX South Suburban #08018312 Report a problem | ||
| Year | Property taxes | Tax assessment |
|---|---|---|
| 2023 | $6,443 +8.9% | $17,410 +42.5% |
| 2022 | $5,915 -0.4% | $12,215 |
| 2021 | $5,940 +8.3% | $12,215 |
| 2020 | $5,485 +6.4% | $12,215 +7.1% |
| 2019 | $5,155 -0.4% | $11,400 |
| 2018 | $5,175 +7.9% | $11,400 |
| 2017 | $4,794 +1.8% | $11,400 +1.7% |
| 2016 | $4,707 +0.8% | $11,208 |
| 2015 | $4,670 +2% | $11,208 |
| 2014 | $4,579 -4.1% | $11,208 -12.4% |
| 2013 | $4,776 +5.3% | $12,800 |
| 2012 | $4,535 +6.6% | $12,800 |
| 2011 | $4,256 -9.7% | $12,800 -20.7% |
| 2010 | $4,715 +2.9% | $16,145 |
| 2009 | $4,583 +8.3% | $16,145 -5% |
| 2008 | $4,230 +17.6% | $16,996 +16.7% |
| 2007 | $3,596 +4.4% | $14,566 |
| 2006 | $3,445 +0.1% | $14,566 |
| 2005 | $3,441 +13.7% | $14,566 +19.1% |
| 2004 | $3,026 +4.8% | $12,225 |
| 2003 | $2,888 +2.2% | $12,225 |
| 2002 | $2,825 +10.3% | $12,225 +6.1% |
| 2001 | $2,562 +1.4% | $11,527 |
| 2000 | $2,528 +0% | $11,527 |
| 1999 | $2,528 | $11,527 |
Find assessor info on the county website
Source: MRED as distributed by MLS GRID. This data may not be complete. We recommend contacting the local school district to confirm school assignments for this home.