$292,900
3 bd|2 ba|1.3k sqft
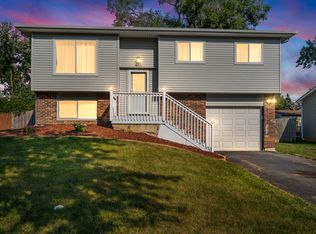
211 Seabury Rd, Bolingbrook, IL 60440
Off Market
$340,000
$316,000 - $364,000
$3,248/mo
List your home for rent
$3,248/mo
Rent Zestimate®
Find your next renter with Zillow Rental Manager. Plus, with online applications, you can quickly screen prospective tenants – for free.
Learn more$3,248/mo
Rent Zestimate®
Refinance and save
$2,400/mo
Est. payment
Refinancing to a lower rate could help reduce your monthly payments and save thousands over the life of the loan.
See today's rates$2,400/mo
Est. payment
Work with a Zillow partner agent
Leverage their expertise and Zillow's premium Showcase listings to get your home seen by more buyers.
Get startedList with your own agent
Get your home in front of millions of buyers by listing it on Zillow.
Learn how to do itSell it yourself
Take full control of how buyers see your home on Zillow by listing For Sale by Owner (FSBO).
List your homeZillow last checked: 7 hours ago
Listing updated: March 27, 2026 at 03:30pm
Christina Maloney (630)853-2095,
Real Broker, LLC
Amy Alvarez
Homes R Us Real Estate Service
| Date | Event | Price |
|---|---|---|
| 3/27/2026 | Sold | $339,900$190/sqft |
Source: | ||
| 2/17/2026 | Contingent | $339,900$190/sqft |
Source: | ||
| 2/1/2026 | Price change | $339,900-2.9%$190/sqft |
Source: | ||
| 1/21/2026 | Listed for sale | $349,900+55.5%$195/sqft |
Source: | ||
| 1/26/2021 | Sold | $225,000-6.2%$126/sqft |
Source: | ||
| Year | Property taxes | Tax assessment |
|---|---|---|
| 2023 | $8,245 +7.2% | $93,000 +10.9% |
| 2022 | $7,695 +5.6% | $83,844 +7% |
| 2021 | $7,288 +3.2% | $78,395 +3.4% |
Find assessor info on the county website
Source: MRED as distributed by MLS GRID. This data may not be complete. We recommend contacting the local school district to confirm school assignments for this home.